Timing Market Volatility (2)
Blog ArchiveI’m busy working on my S&P500 Volatility Model tonight and I’m slowly inching toward a better correlation. Despite my headway, it still needs a lot of work to be statistically significant. Right now its close to 75% correlated but I still haven’t figured out how I want to rank the volatility events.
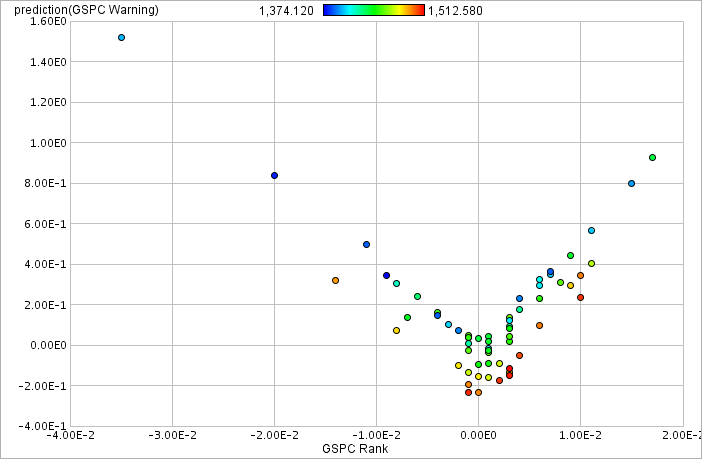 I did create a nice image of how the data looks after its modeled. The x-axis is the rate of price change in the S&500 closing price and the y-axis is the volatility event (1 being severe and 0 being safe). If you squint at the image you can see a possible “U†shape outline, which means that this model could be explained by a second order function (parabola).
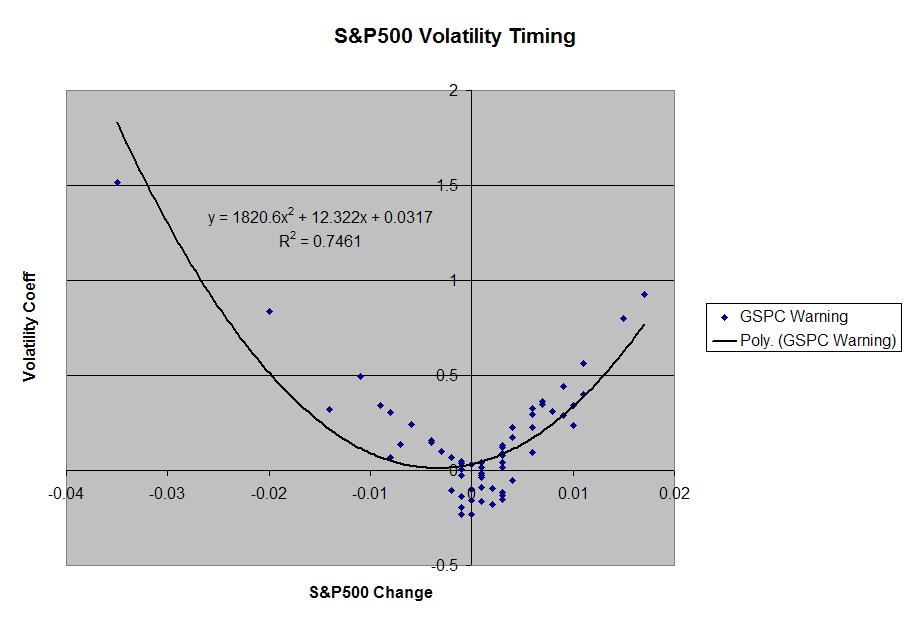 The next image, a chart from my Excel spreadsheet, shows the parabolic function of the modeled data.
Well, back to work!
[tags]S&P500, Volatility, Models, NeuralNet, Timing, Quantitative, Finance[/tags]
The next image, a chart from my Excel spreadsheet, shows the parabolic function of the modeled data.
Well, back to work!
[tags]S&P500, Volatility, Models, NeuralNet, Timing, Quantitative, Finance[/tags]