RapidMiner Tutorials
AI Machine Learning RapidMiner Tutorials GroovyIt would appear that making a rolling list of all my old and newer RapidMiner Tutorials would be helpful for readers. It should be noted that these tutorials and videos were made for differnet versions of RapidMiner (version 5 to 7) and may look a bit old and dated BUT they are still relevant to this day. The functionality of RapidMiner is still the same but the internal organization and look will be different. Most of the operators are the same name but things like the the Time Series plugin have been fully incorporated into RapidMiner Studio now.

This version was the last true open source version of RapidMiner and was a massive achievement by the team back in 2010. I remember when it came out, it looked awesome and was really powerful for that time. RapidMiner has gone under many changes since then, most notably applying a ‘open core’ type of licensing model where RapidMiner Studio is free to use for only 10,000 rows of data.
I’m a big proponent of open source but I completely understand the need to make money and satisfy the venture capitalists. The real trick is how to thread the needle between what you give away for free (showing the leg) and what you sell (getting them to buy you dinner). For now, the RedHat model of open source seems to be winning in the marketplace. Take open source Linux and build enterprise components around it. You sell the enterprise components. That seems to work for Cloudera too but they made some big mis-steps, so just because a technology is open source (aka free) you can sell mess things up.
Learn RapidMiner and Data Science
I used RapidMiner to do a lot of this time series analysis. If you want to learn more on how to use RapidMiner, I recommend the following books. I know the authors and they do a great job of breaking down how to use RapidMiner and apply it with the concepts of Data Science for your projects.So without further ado, here’s a list of nearly all the videos and tutorials I’ve made. I will add to this list as pull together more of the scattered videos.
Build an AI Finance Model in RapidMiner
Before you can begin with building your own AI Financial Market Model (machine learned), you have to decide on what software to use. Since I wrote this article in 2007, many new advances have been made in machine learning. Notably the python module Scikit Learn came out and Hadoop was released into the wild.
I’m not overly skilled in coding and programming – I know enough to get by- I settled on RapidMiner. RapidMiner is a very simple visual programming platform that let’s you drag and drop “operators” into a design canvas. Each operator has a specific type of task related to ETL, modeling, scoring, and extending the features of RapidMiner.
There is a slight learning curve but, it’s not hard to learn if you follow along with this tutorial!
##The AI Financial Market Model
First download RapidMiner Studio and then get your market data (OHLCV prices), merge them together, transform the dates, figure out the trends, and so forth. Originally these tutorials built a simple classification type of model that look to see if your trend was classified as being in an “up-trend” or a “down-trend.” The fallacy was they didn’t not take into account the time series nature of the market data and the resulting model was pretty bad.
For this revised tutorial we’re going to do a few things.
- Install the Finance and Economics, and Series Extensions
- Select the S&P500 weekly OHLCV data for a range of 5 years. We’ll visualize the closing prices and auto-generate a trend label (i.e. Up or Down)
- We’ll add in other market securities (i.e. Gold, Bonds, etc) and see if we can do some feature selection
- Then we’ll build a forecasting model using some of new H20.ai algorithms included in RapidMiner v7.2
All processes will be shared and included in these tutorials. I welcome your feedback and comments.
The Data
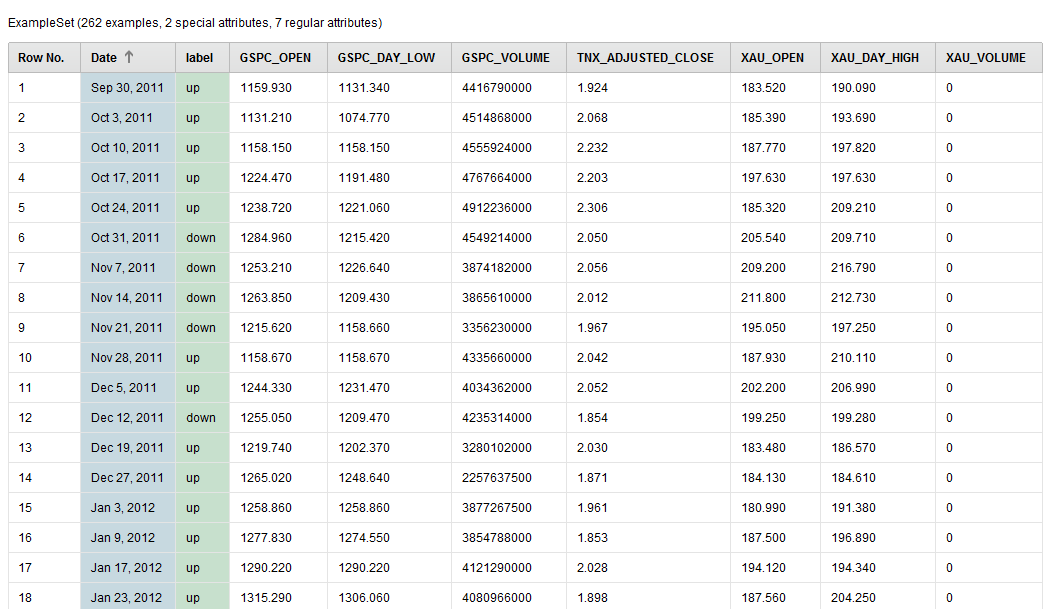
We’re going to use the adjusted closing prices of the S&P500, 10 Year Bond Yield, and the Philadelphia Gold Index from September 30, 2011 through September 20, 2016.
The raw data looks like this:
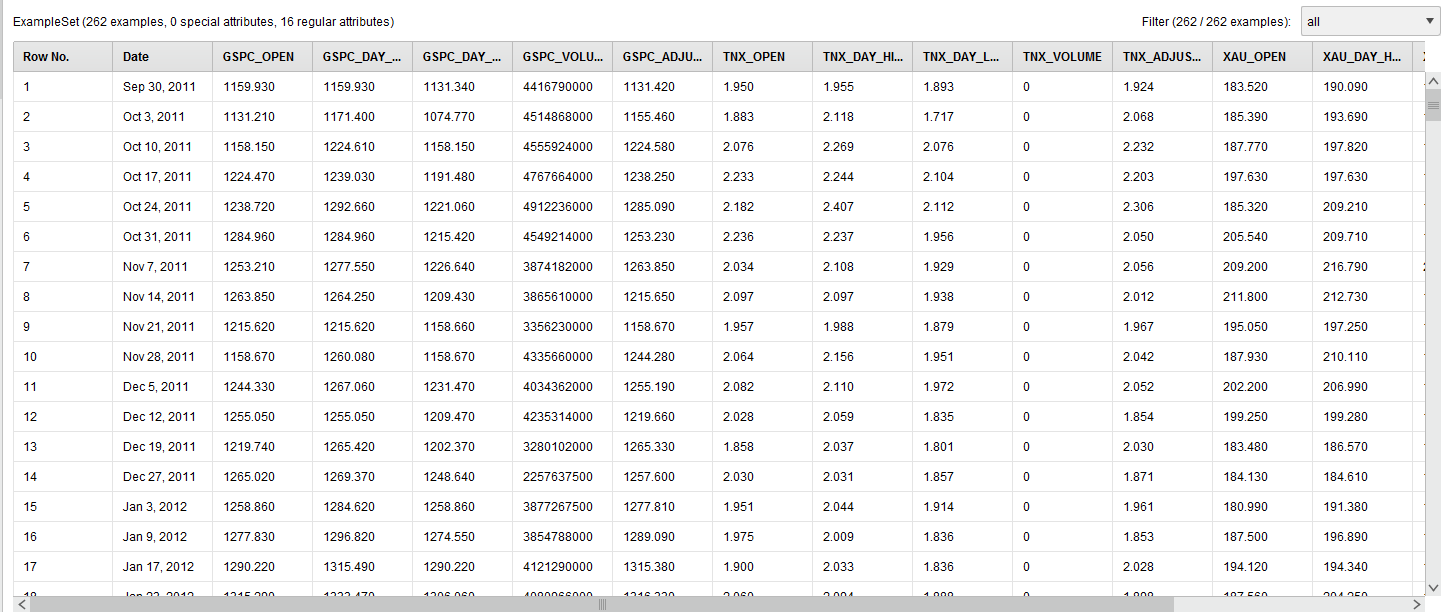
We renamed the columns (attributes) humanely by removing the “^” character from the stock symbols.
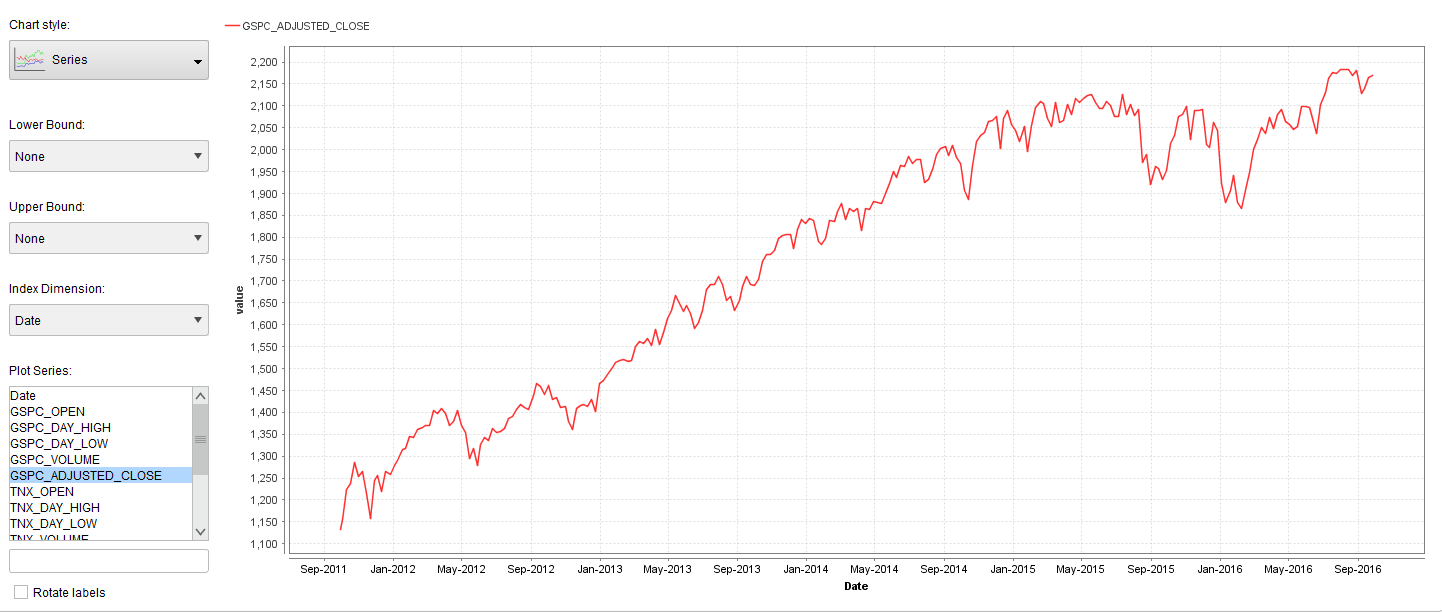
Next we visualized the adjusted weekly closing price of the S&P500 using the built in visualization tools of RapidMiner.
The next step will be to transform the S&P500 adjusted closing price into Up and Down trend labels. To automatically do this we have to install the RapidMiner Series Extension and use the Classify by Trend operator. The Classify by Trend operator can only work if you set the set the SP500_Adjusted_Close column (attribute) as a Label role.
The Label role in RapidMiner is your target variable. In RapidMiner all data columns come in as “Regular” roles and a “Label” role is considered a special role. It’s special in the sense that it’s what you want the machine learned model to learn to. To achieve this you’ll use the Set Role operator. In the sample process I share below I also set the Date to the ID role. The ID role is just like a primary key, it’s useful when looking up records but doesn’t get built into the model.
The final data transformation looks like this:
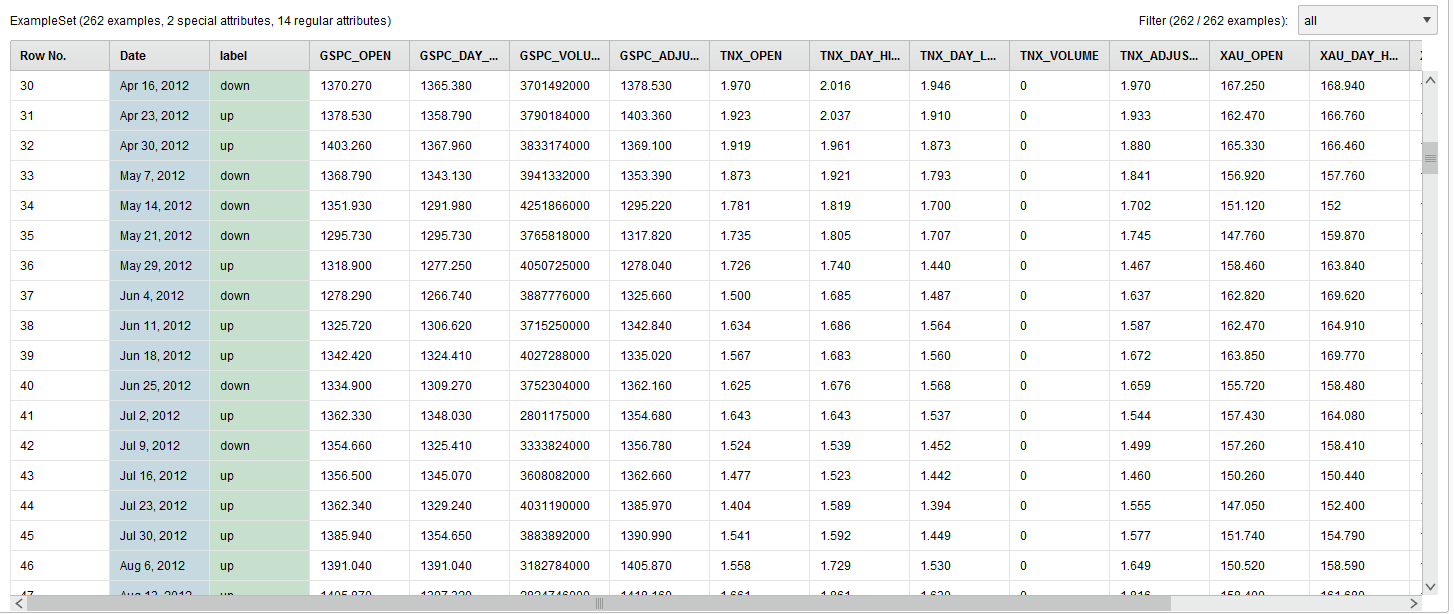
The GSPC_Adjusted_Close column is now transformed and renamed to the label column.
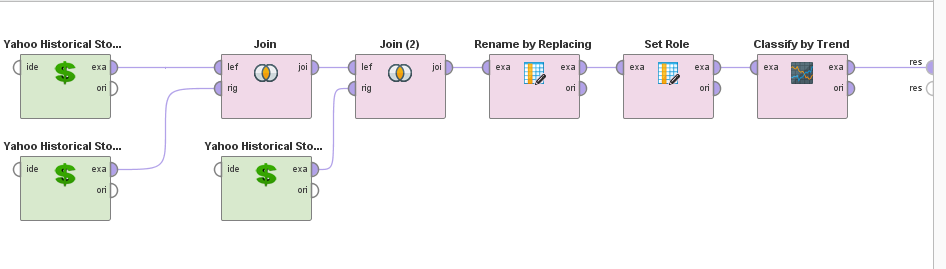
The resulting process looks like this:
Next, I want to show you how to use MultiObjective Feature Selection (MOFS) in RapidMiner**. **It’s a great technique to simultaneously reduce your attribute set and maximize your performance (hence: MultiObjective). This feature selection process can be run over and over again for your AI Financial Market Model, should it begin to drift.
Load in the Process
Start by reading the Building an AI Financial Market Model – Lesson 1 post. At the bottom of that post you can download the RapidMiner process.
Add an Optimize Selection (Evolutionary) operator
The data that we pass through the process contains the adjusted closing prices of the S&P500, 10 Year Bond Yield, and the Philadelphia Gold. Feature Selection let’s us chose which one of these attributes contributes the most to the overall model performance, and which really don’t matter at all.
To do that, we need to add an Optimize Selection (Evolutionary) operator.
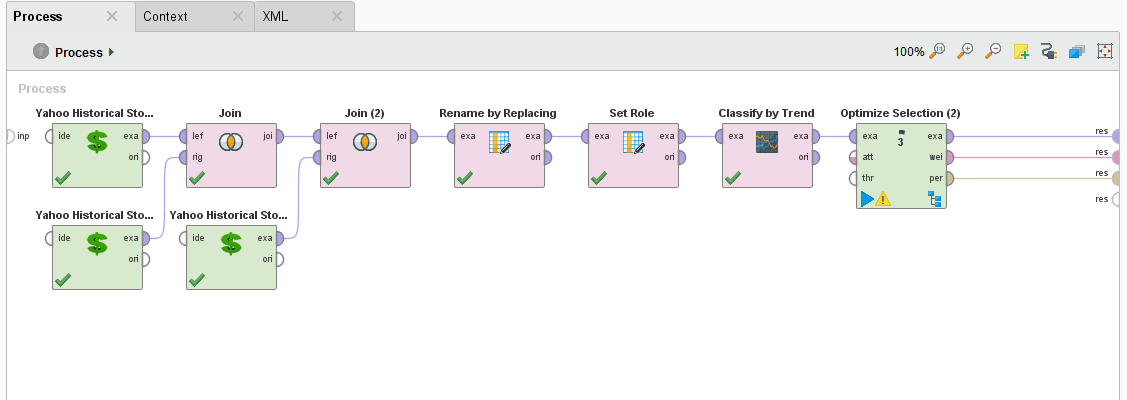
Why do you want to do MultiObjective Feature Selection? There are many reasons but most important of all is that a smaller data set increases your training time by reducing consumption of your computer resources.
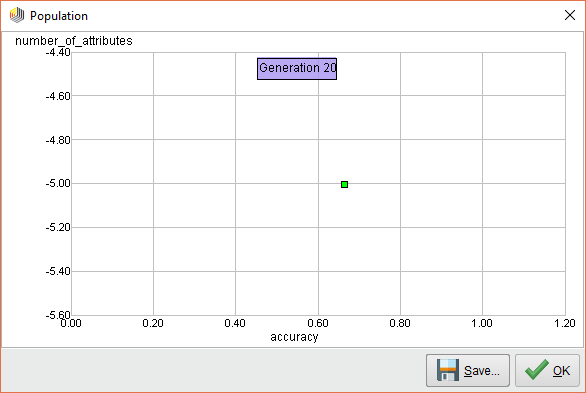
When we execute this process, you can see that the Optimize Selection (Evolutionary) operator starts evaluating each attribute. At first, it measures the performance of ALL attributes and it looks like it’s all over the map.
How it measures the performance is with a Cross Validation operator embedded inside the subprocess.
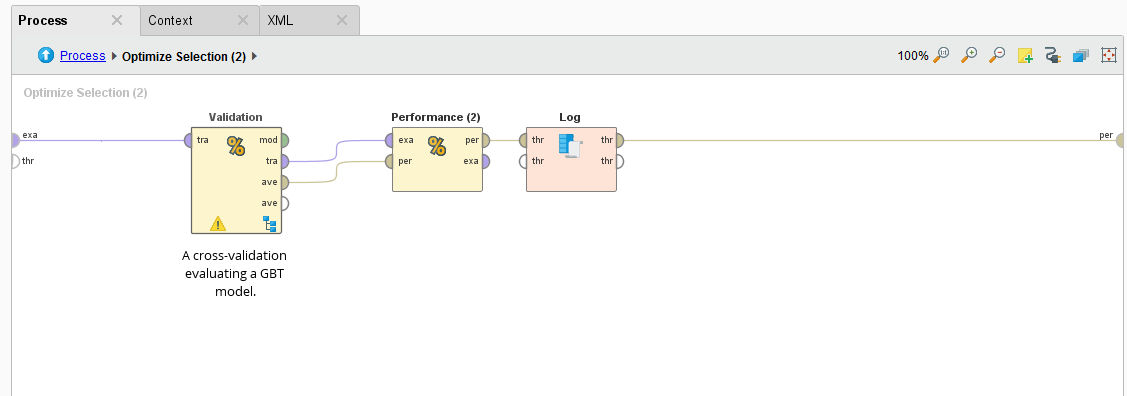
The Cross Validation operator use a Gradient Boosted Tree algorithm to analyze the permutated inputs and measures their performance in an iterative manner. Attributes are removed if they don’t provide an increase in performance.
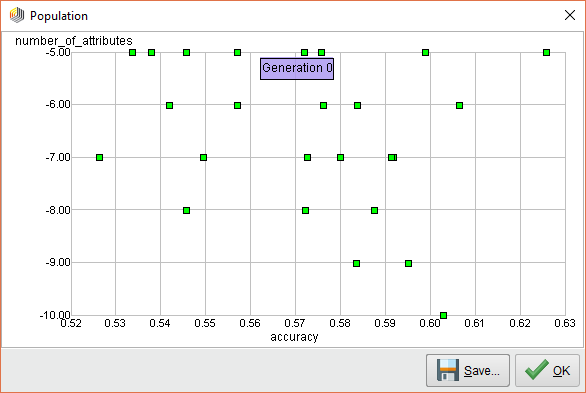
MultiObjective Feature Selection Results
From running this process, we see that the following attributes provide the best performance over 25 iterations.
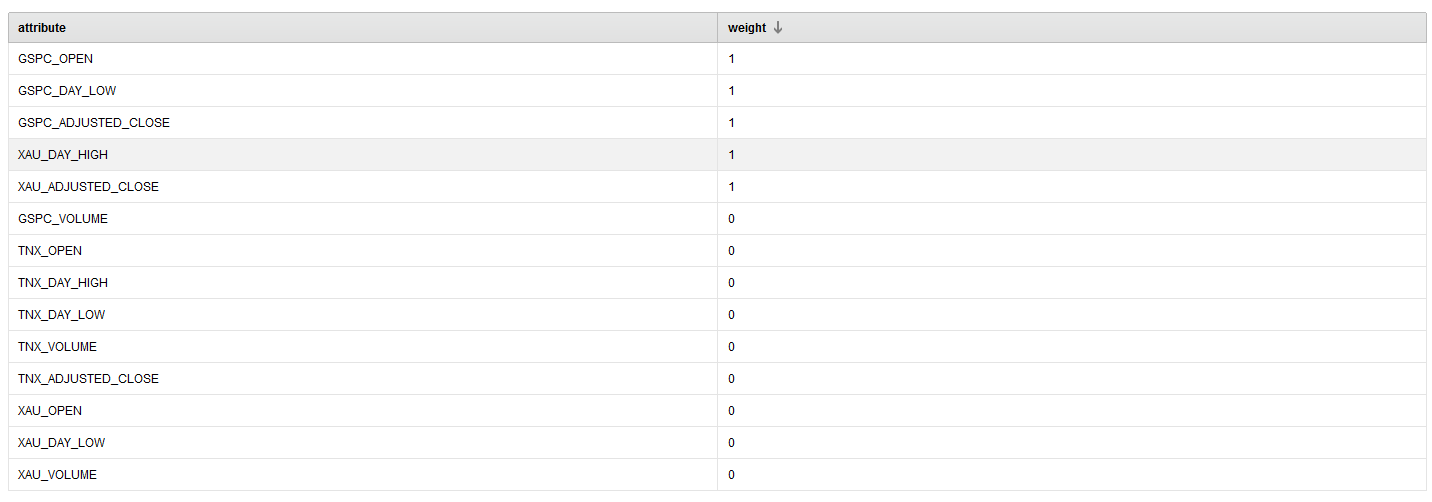
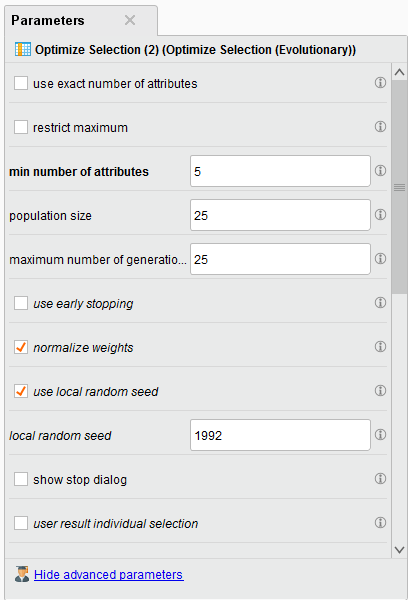
Note: We choose to have a minimum of 5 attributes returned in the parameter configuration. The selected ones have a weight of 1.
The resulting performance for this work is below.
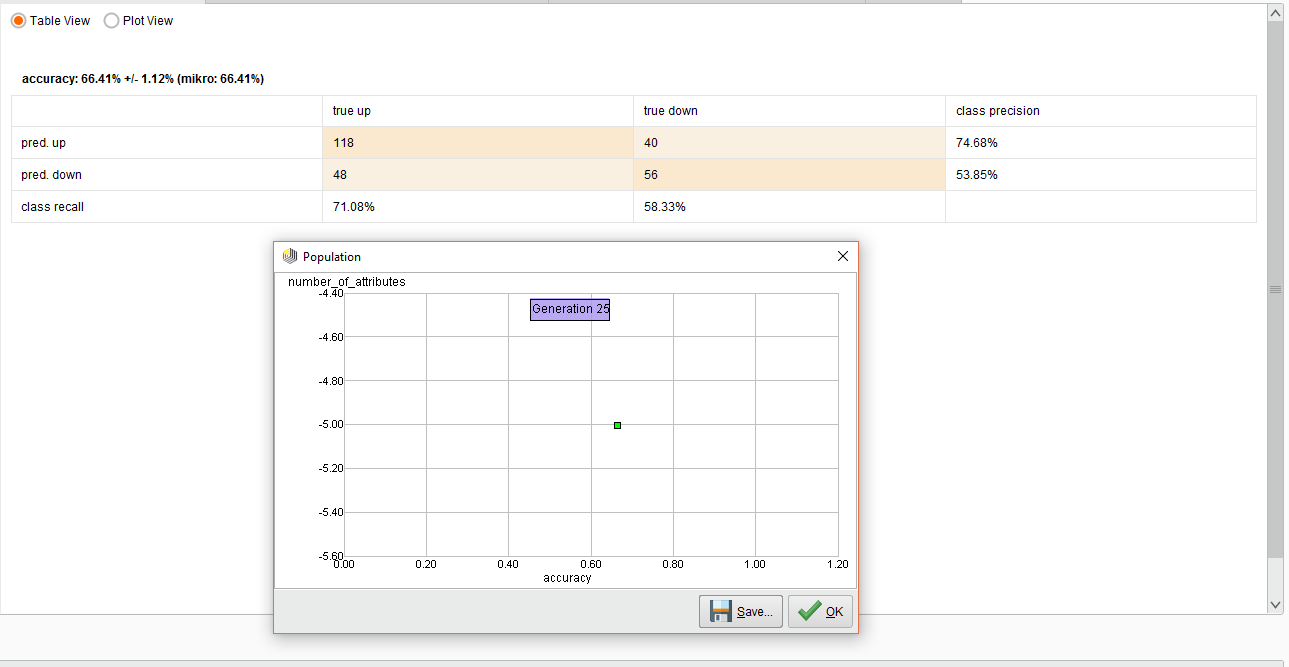
The overall accuracy was 66%. In the end predicting and UP trend was pretty decent, but not so good for the DOWN trend.
The possible reason for this poor performance is that I purposely made a mistake here. I used a Cross Validation operator instead of using a Sliding Window Validation operator.
The Sliding Window Validation operator is used to backtest and train a time series model in RapidMiner and we’ll explain the concepts of Windowing and Sliding Window Validation in the next Lesson.
Note: You can use the above method of MultiObjective Feature Selection for both time series and standard classification tasks.
Above, I went over the concept of MultiObjective Feature Selection (MOFS). In this lesson we’ll build on MOFS for our model but we’ll forecast the trend and measure it’s accuracy.
Revisiting MOFS
We learned in lesson 2 that RapidMiner can simultaneously select the best features in your data set while maximizing the performance. We ran the process and the best features were selected below.
From here we want to feed the data into three new operators that are part of the Series Extension. We will be using the Windowing, Sliding Window Validation, and the Forecasting Performance operator.
These there operators are key to measure a performance of your time series model. RapidMiner is really good and determining the directional accuracy of time series and a bit rough when it comes to point forecasts. My personal observation is that it’s futile to get a point forecast for an asset price, you have better luck with direction and volatility.
Our forecasting model will use a Support Vector Machine and and RBF kernel. Time series appear to benefit from this combination and you can always check out this link for more info.
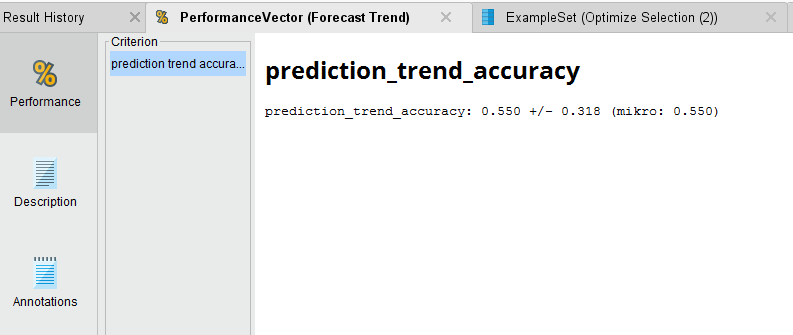
Forecast Trend Accuracy
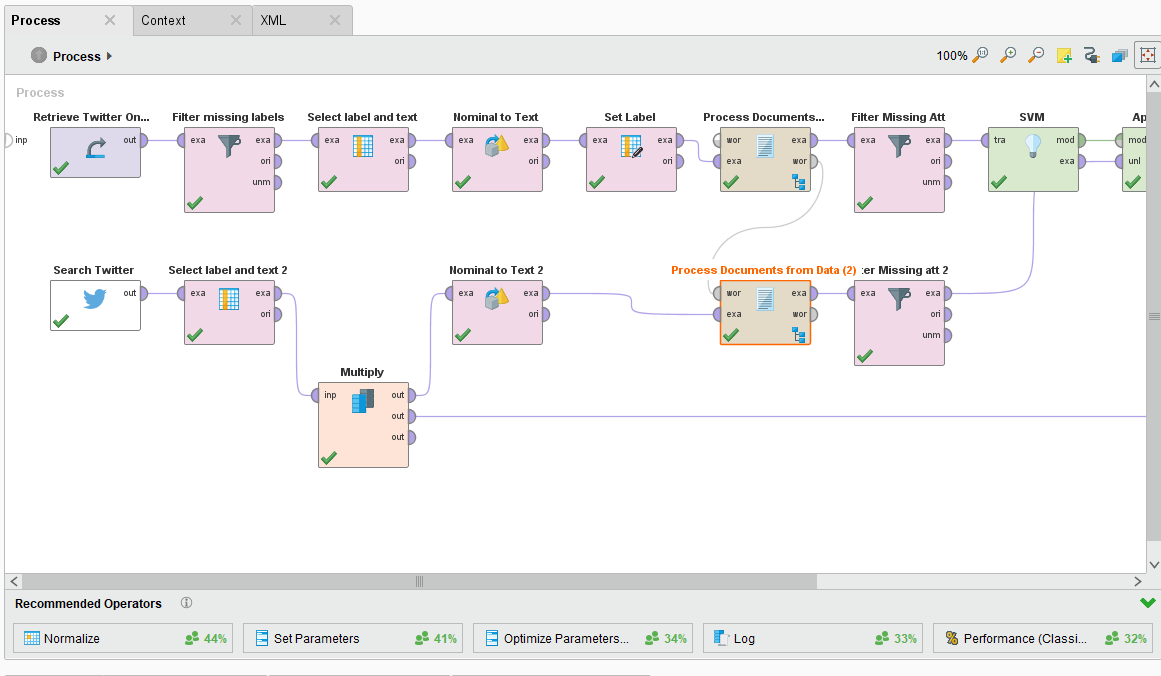
The Process
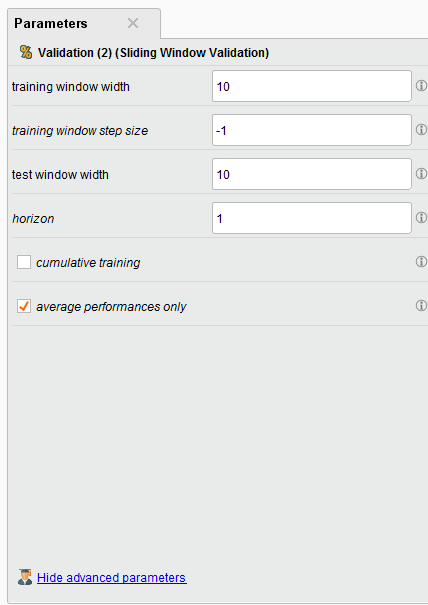
Sliding Window Validation Parameters
Windowing the Data
RapidMiner allows you to do multivariate time series analysis also known as a model driven approach to analysis. This is different than a data driven approach, such as ARIMA, and allows you to use many different inputs to make a forecast. Of course, this means that point forecasting becomes very difficult when you have multiple inputs, but makes directional forecast more robust.
The model driven approach in RapidMiner requires you to Window your Data. To do that you’ll need to use the Window operator. This operator is often misunderstood, so I suggest you read my post in the community on how it works.
Tip: Another great reference on using RapidMiner for time series is here.
There are key parameters that you should be aware of especially the window size, the step size, whether or not you create a label, and the horizon.
When it comes to time series for the stock market, I usually choose a value of 5 for my window. This can be fore 5 days, if your data is daily, or 5 weeks if it’s weekly. You can choose what you think is best.
The Step Size parameter tells the Windowing operator to create a new window with the next example row it encounters. If it was set to two, then it will move two examples ahead and make a new window.
Tip: The Series Representation parameter is defaulted to “encode_series_by_examples.” You should leave this default if your time series data is row by row. If a new value of your time series data is in a new column (e.g. many columns and one row), then you should change it to “encode_series_by_attributes.”
Sliding Validation
The Sliding Window Validation operator is what is used to backtest your time series, it operates differently than a Cross Validation because it creates a “time window” on your data, builds a model, and tests it’s performance before sliding to another time point in your time series.
In our example we create a training and testing window width of 10 example rows, our step size is -1 (which is the size of the last testing window), and our horizon is 1. The horizon is how far into the future we want to predict, in this case it’s 1 example row.
There are some other interesting toggle parameters to choose from. The default is average performances only, so your Forecast Trend Accuracy will be your average performance. If you toggle on “cumulative training” then the Sliding Window Validation operator will keep adding the previous window to the training set. This is handy if you want see if the past time series data might affect your performance going forward BUT it makes training and testing very memory intensive.
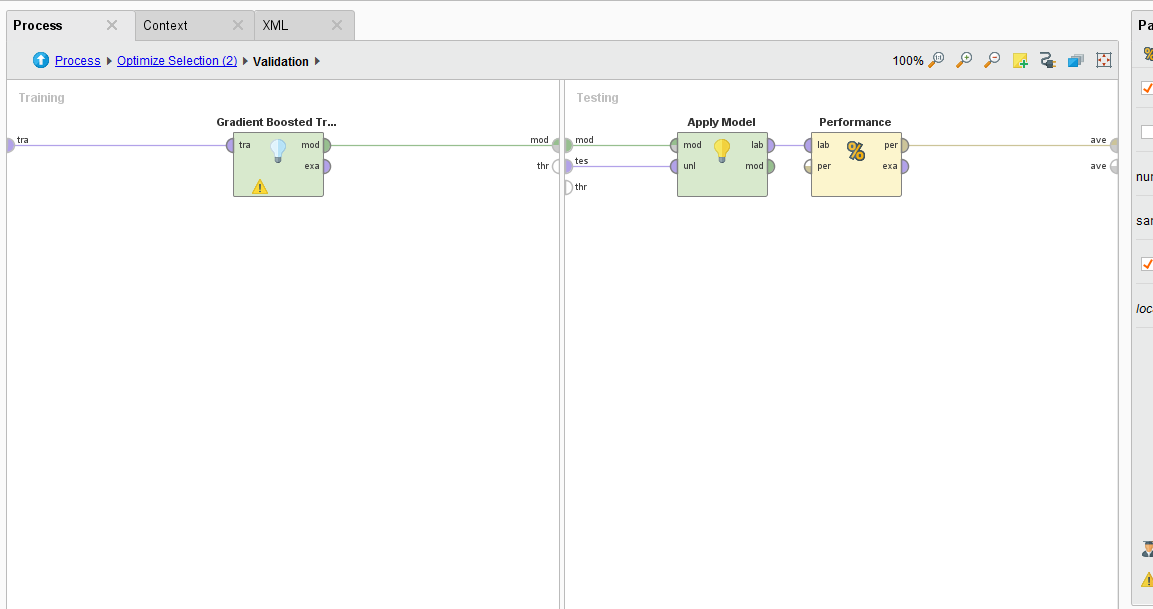
Double clicking on the Sliding Window Validation operator we see a typical RapidMiner Validation training and testing sides where we can embed our SVM, Apply Model, and Forecasting Performance operators. The Forecasting Performance operator is a special Series Extension operator. You need to use this to forecast the trend on any time series problem.
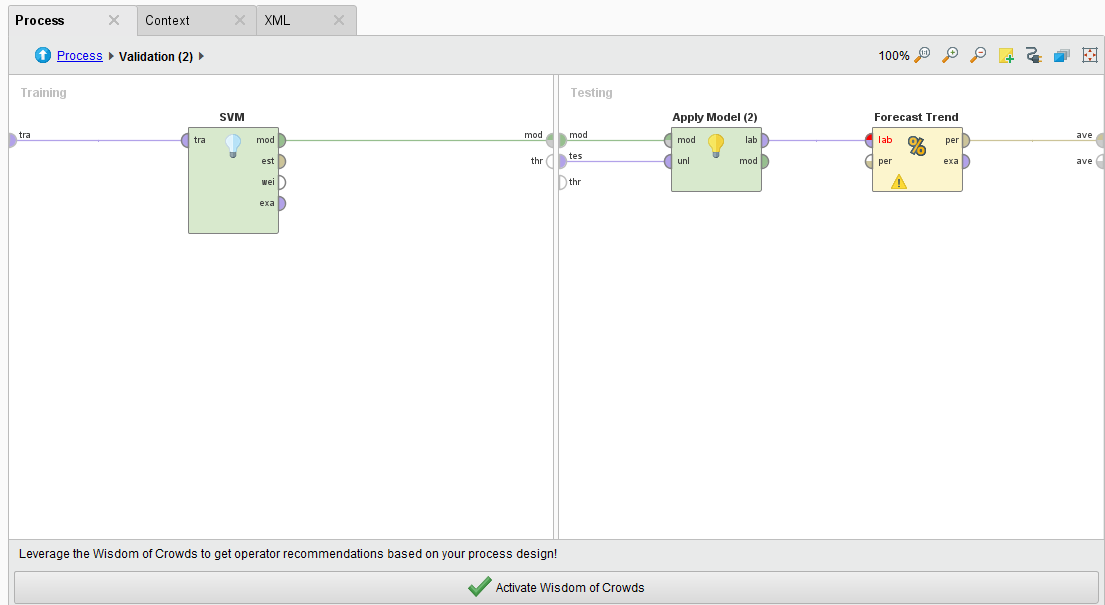
Forecast the Trend
Once we run the process and the analysis completes, we see that we have a 55.5% average accuracy to predict the direction of the trend. Not great, but we can see if we can optimize the SVM parameters of C and gamma to get better performance out of the model.
In my next lesson I’ll go over how to do Optimization in RapidMiner to better forecast the trend.
Above I introduced the Sliding Window Validation operator to test how well we can forecast a trend in a time series. Our initial results are very poor, we were able to forecast the trend with an average accuracy of 55.5%. This is fractionally better than a simple coin flip! In this updated lesson I will introduce the ability of Parameter Optimization in RapidMiner to see if we can forecast the trend better.
Parameter Optimization
We begin with the same process in Lesson 3 but we introduce a new operator called the Optimize Parameter (Grid) operator. We also do some house cleaning for putting this process into production.
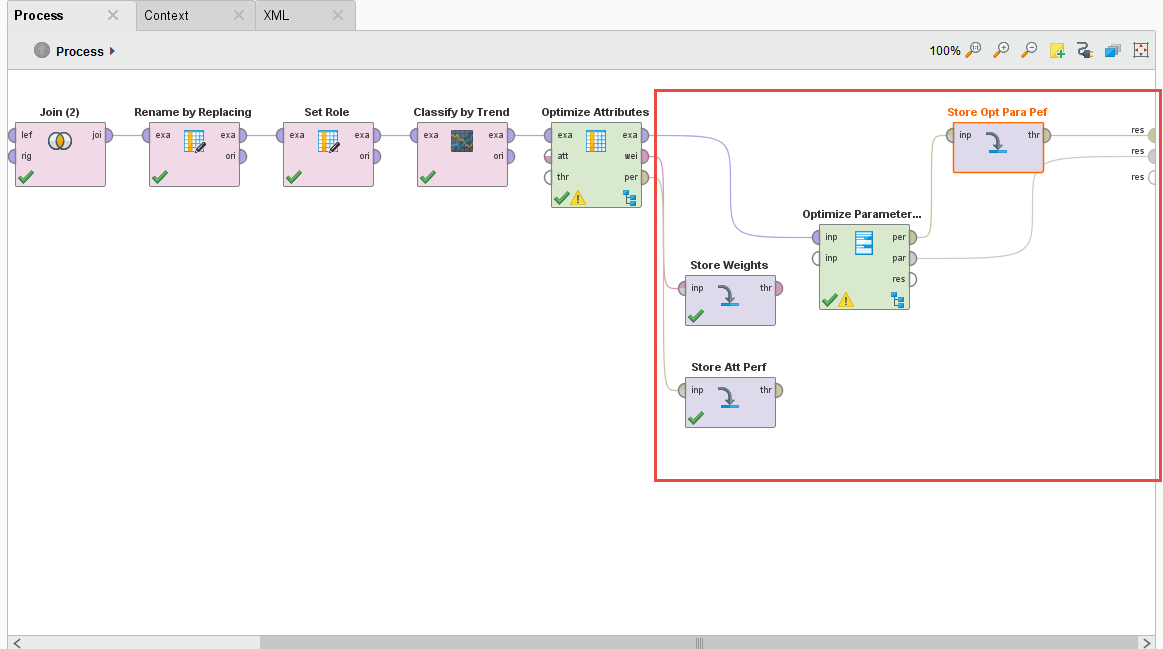
The Optimize Parameter (Grid) operator let’s you do some amazing things, it lets you vary – by your predefined limits – parameter values of different operators. Any operator that you put inside this operator’s subprocess can have their parameters automatically iterated over and the overall performance measured. This is a great way to fine tune and optimize models for your analysis and ultimately for production.
For our process, we want to vary the training window width, testing window width, training step width on the Sliding Window Validation operator, the C and gamma parameter of the SVM machine learning algorithm, and the forecasting horizon on the Forecast Trend Performance operator. We want to test all combinations and ultimately determine the best combination of these parameters that will give us the best tuned trend prediction.
Note: I run a weekly optimization process for my volatility trend predictions. I’ve noticed depending on market activity, the training width of the Sliding Window Validation operator needs to be tweaked between 8 and 12 weeks.
I also add a few Store operators to save the Performance and Weights of the Optimize Selection operator, and the Performance and Parameter Set of the Optimization Parameter (Grid) operator. We’ll need this data for production.
Varying Parameters Automatically
Whatever operators you put inside the Optimize Parameters (Grid) operator can have their parameters varied automatically, you just have to select which ones and set minimum and maximum values. Just click on the Edit Parameter settings button. Once you do, you are presented with a list of available operators to vary. Select one operator and another list of available parameters is shown. Then select which parameter you want and define min/max values.
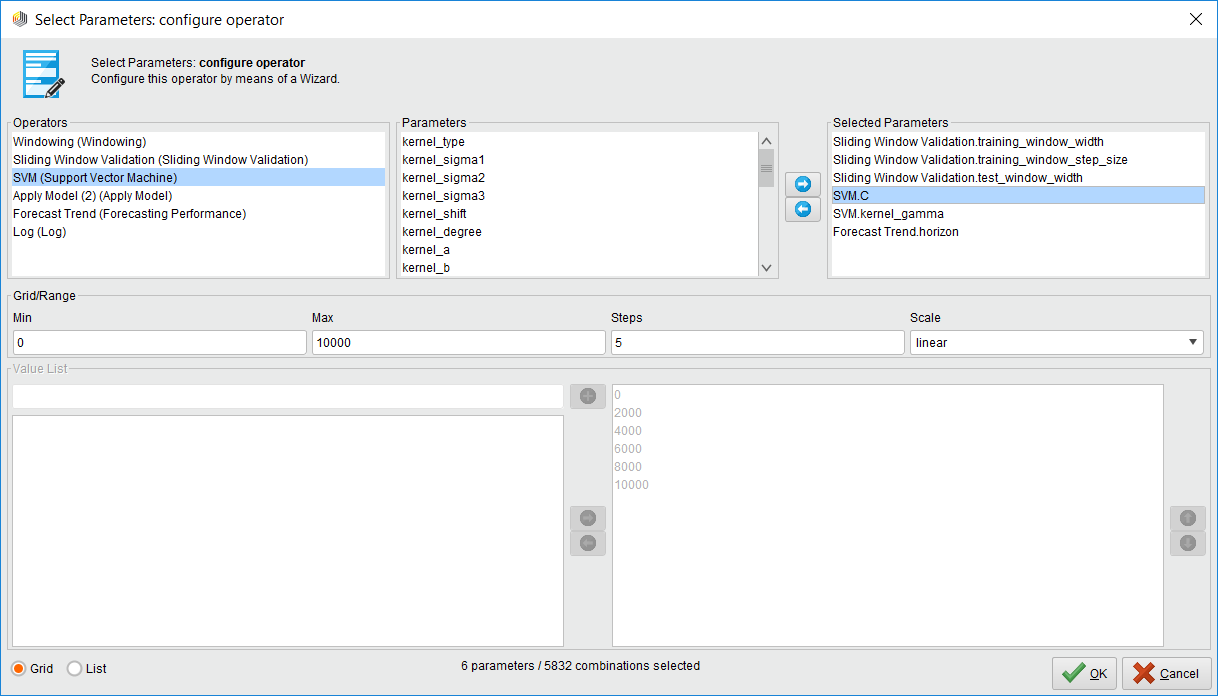
Note: If you select a lot of parameters to vary with a very large max value, you could be optimizing for hours and even days. This operator consumes your computer resources when you millions of combinations!
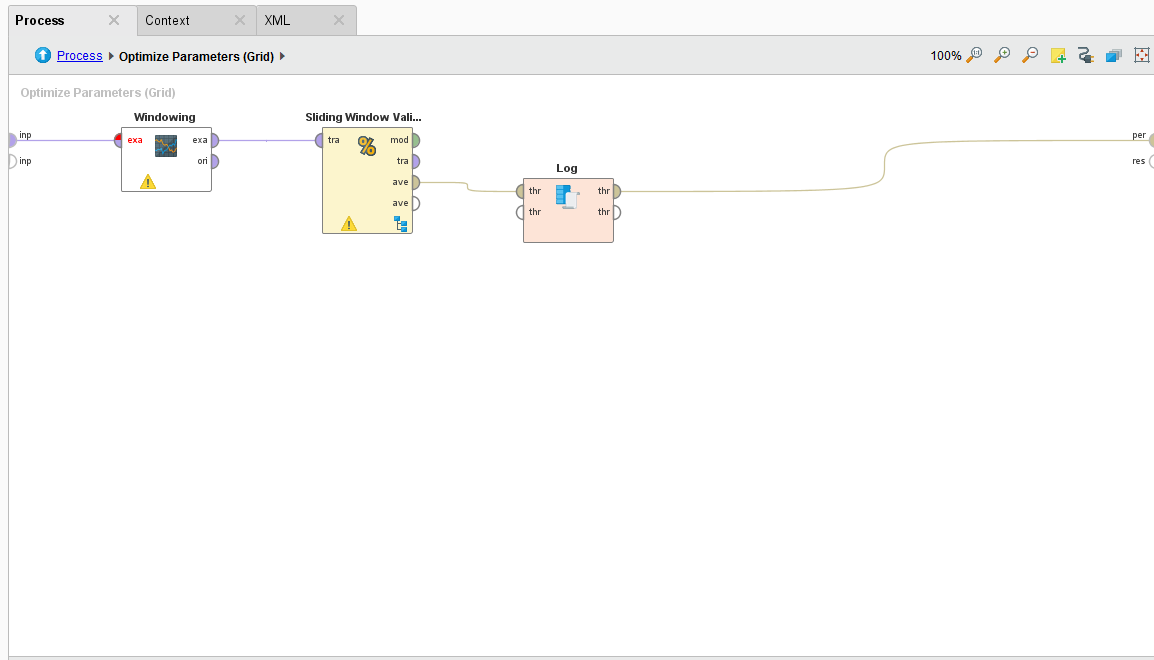
The Log File
The log file is a handy operator that we use in optimization because we can create a custom log file that has the values of the parameters we’re measuring and the resulting forecast performance. You just name your column and select which operator and parameter you want to have an entry for.
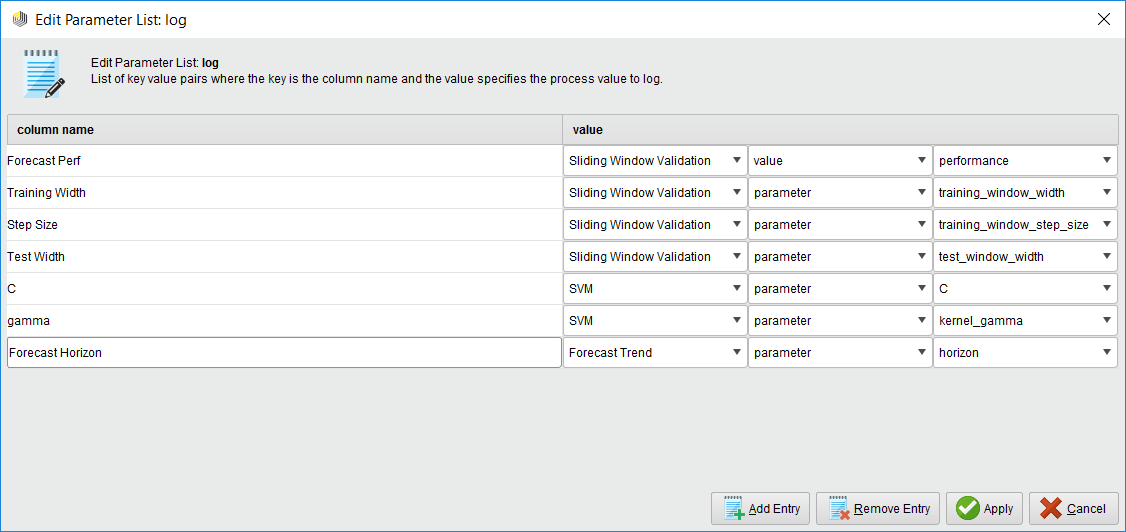
Pro Tip: If you want to measure the performance, make sure you select the Sliding Window Validation operator’s performance port and NOT the Forecast Trend Performance operator. Why? Because the Forecast Trend Performance operator generates several models as it slides across the time series. Some performances are better than others. The Sliding Window Validation operator averages all the results together, and that’s the measure you want!
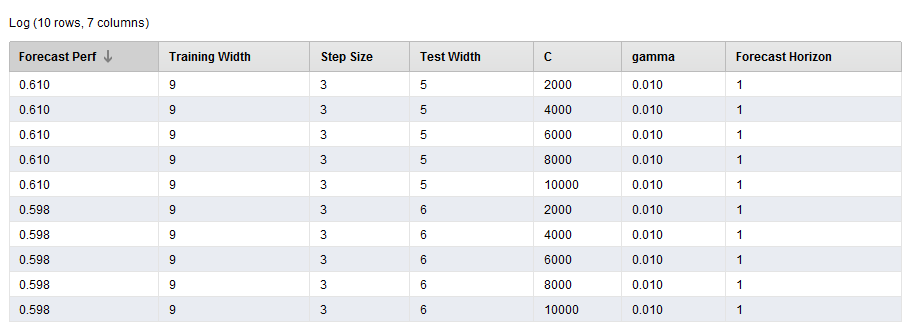
This is a great way of seeing what initial parameter combinations are generating the best performance. It can also be used to visualize your best parameter combinations too!
The Results
The results are point to a parameter combination of:
- Training Window Width: 10
- Testing Window Width: 5
- Step Width: 4
- C: 0
- Gamma: 0.1
- Horizon: 3
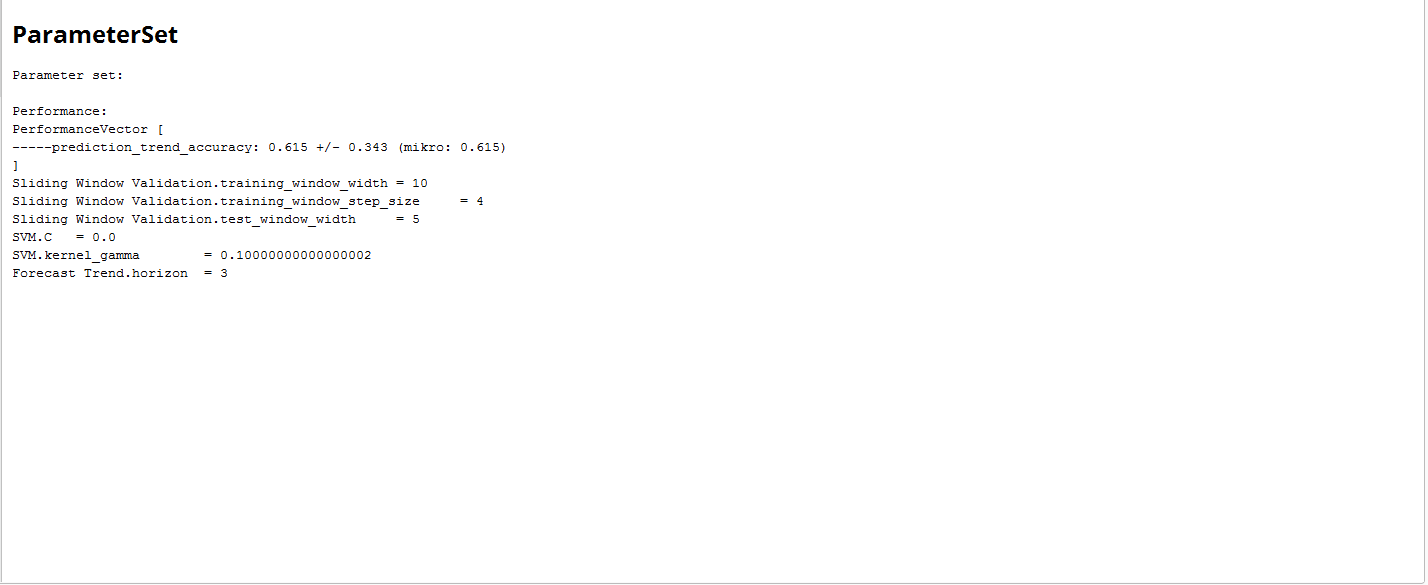
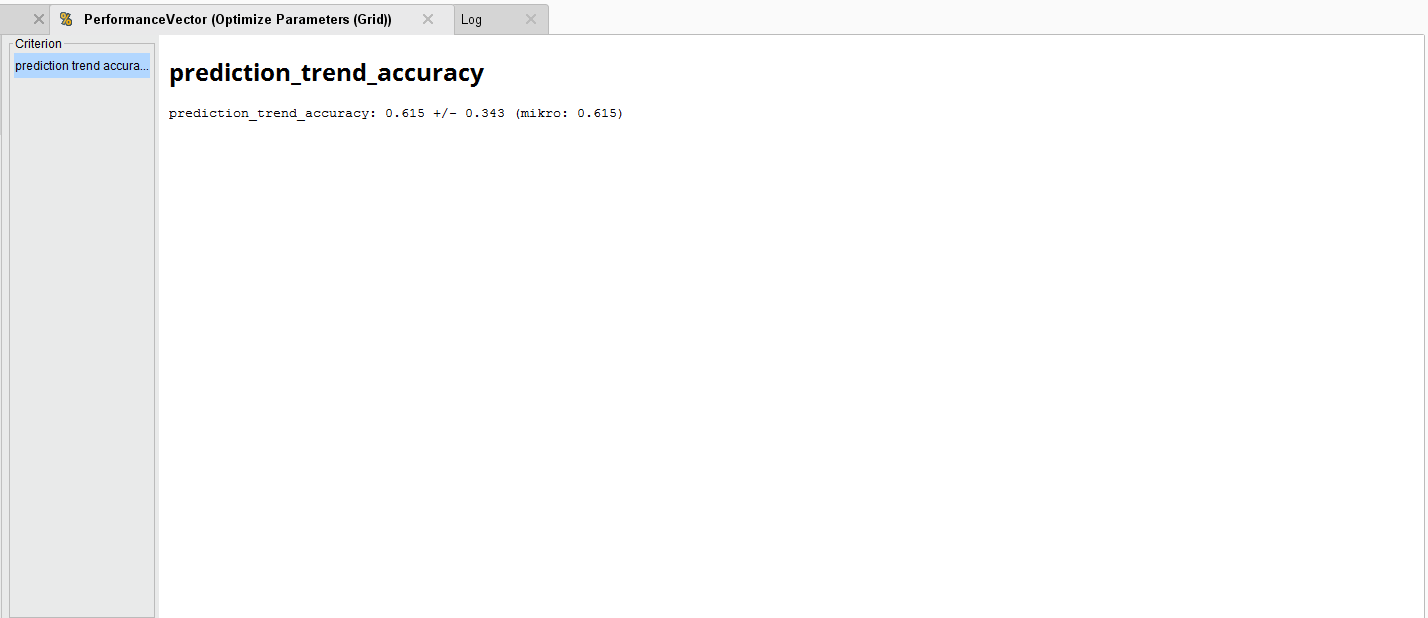
To generate an average Forecast Trend accuracy of 61.5%. Compared to the original accuracy, this is an improvement.
Introduction to RapidMiner
After a very long hiatus I present to my readers my first Rapidminer 5.0 video tutorial. It’s just a quick 10 min introduction to the GUI and data import functions of Rapidminer 5.0. You’re gonna like the way it looks!
PS: My Youtube Channel is here: Neuralmarkettrends1
PPS: For those who want to follow along, see the original GE.xls file.
This video is for the old open source RapidMiner 5.0. You can find a copy of it here.
Update to the first video
It’s hard to believe that I made these RapidMiner videos over 10 years ago. I find it really cool that I still get a lot of visitors coming to this site to learn RapidMiner, even if these videos are really old and superseded by RapidMiner’s own fancy videos now.
So what can I do now for people that come here looking to learn RapidMiner? Well if my SEO tells me anything, people really like to learn about Time Series forecasting for the markets. They want to use RapidMiner because it’s zero to low code environment. After all, that’s how I got to RapidMiner in the first place and inspired this blog.
The reality is that over time forecasting and predicting things is hard. You could make a living and building trading models and making money in the markets but it’s hard. I recommend doing the passive investing way but if you’re coming here to learn about using RapidMiner then I’d suggest you visit RapidMiner’s updated videos. RapidMiner now is a platform that has a free option but to process any more than 10,000 rows you have to buy it, and it ain’t cheap last time I checked.
If you want to learn time series, forecasting, and even deep learning the market environment then I suggest you skip RapidMiner and dive right into Python. You really need to understand what you are doing with time series and if you want to do a fast ‘half-assed’ job at learning this, then you’ll end up wasting your time and possibly losing money in the markets.
So instead of making new videos, I wanted to append these videos with something more relevant and hopefully start you off on the right foot. I was inspired by this Medium post and I figured it would make more sense to not reinvent the wheel but rather build on the work of others, much like many past readers have done with my videos.
So I offer you my Tutorial Github page. It’s where I’ll be posting the code I share here on this blog and rebuilding older tutorials, as time permits.
Gold Classification Model in RapidMiner - Part 1
Looks like I’m on a roll! Please see my Rapidminer 5.0 Video Tutorial #2. In this video we begin the process of recreating my original written NMT YALE/Rapidminer tutorials into version 5.0 and into a video. This video shows how to import training and prediction data, add a classification learner, and apply the model, and get the results.
The data files you will need to follow along are Excel spreadsheets below:
Training data set: gold_final_input
Prediction data set: ga-gold
This video and the next are my complete (NOOB) screw ups when it comes to applying machine learning to time series. I would skip over these and use this Python Notebook I put together using someone else’s great tutorial.
The Python Notebook uses ARIMA and stationarity to analyze a time series and forecast it. ARIMA is not perfect and it doesn’t work well in a trend unless you extract the trend’s residuals and test them for stationarity. It’s all quite complex but better than this model.
Gold Classification Model in RapidMiner - Part 2
In this video I discuss how to use a cross and simple validation operator to split your training data into two sets: training and validation data sets.I also highlight the new intuitive “quick fix” error solution suggestions in Rapidminer 5.0. Enjoy!
Genetic Optimziaton in RapidMiner
In this video I highlight the data generation capabilities for Rapidminer 5.0 if you want to tinker around, and how to use a Genetic Optimization data pre-processor within a nested nested experiment. Yes, you read that correctly, a nested nested experiment.
Preprocessing Data with RapidMiner
In this video we continue where we left off in Video Tutorial #4. We discuss some of the parameters that are available in the Genetic Algorithm data transformers to select the best attributes in the data set. We also replace the first operator with another Genetic Algorithm data transformer that allows us to manipulate population size, mutation rate, and change the selection schemes (tournament, roulette, etc).
Create a Decision Tree in RapidMiner
Calling all marketers! In this video we discuss how we can use Rapidminer to create a decision tree to help us find “sweet spots” in a particular market segment. This video tutorial uses the Rapidminer direct mail marketing data generator and a split validation operator to build the decision tree.
Evolutionary Weighting in RapidMIner
In this tutorial, we highlight Rapidminer’s weighting operator using an evolutionary approach. We use financial data to preweight inputs before we feed them into a neural network model to try to better classify a gold trend.
Financial Time Series Discovery in RapidMiner
In this video we review data discovery techniques for Financial Time Series data by calculating a Simple Moving Average (SMA), creating a non-linear trend line using a Neural Net operator, and creating a time series prediction line using a Neural Net operator.
Time Series in RapidMiner - Part 1
In this video we start building a financial time series model, using S&P500 daily OHLCV data, and the windowing, sliding validation, and forecasting performance operator. This Part 1.
Here is the XLS training files.
- [S&P500 Training XLS](/_public/2010/GSPC Time Series Training Data.xls)
Time Series in RapidMiner - Part 2
In this video we continue building a financial time series model, using S&P500 daily OHLCV data, and the windowing, sliding validation, and forecasting performance operator. We test the model with some out of sample S&P500 data.
Here are the XLS training and out of sample files.
- [S&P500 Training XLS](/_public/2010/GSPC Time Series Training Data.xls)
- [S&P500 Out of Sample XLS](GSPC Time Series Out of Sample Data.xls)
Pattern Recognition in RapidMiner
I’m back to making new videos again, at least for a little while! This new video showcases the Pattern Recognition & Landmarking plugin that was unveiled at RCOMM 2010.
This plugin is fantastic! It analyzes your data, ranks the best type of learners that should yield the highest accuracy, and then automatically constructs the process for you. Its so great that it helps answer one of the most often asked questions from my readers, “which learner should I use for my data?”
Build Trading Rules with RapidMiner
In this video I highlight the often overlooked (I know I did) Generate Attribute operator to create trading rules. This operator is not just applicable to financial data but to any data set where you want to transform and create new attributes "on the fly."
No sooner did I post this video that I received a notification of a new post at the Rapid-I blog about this operator. They’re going to extend nominal values in the Generate Attribute operator in Rapidminer 5.1.
Parameter Optimization in RapidMiner
In this Rapidminer Video Tutorial I show the user how to use the Parameter Optimization operator to optimize your trained data. The example shows how Rapidminer iterates the learning rate and momentum for a Neural Net Operator to increase the performance of the trained data set.
Video #14 will be about web mining financial text data.
Updated: this tutorial is still valid for RapidMiner versions 5+, 6+, and 7+
Web Mining Data in RapidMiner
In this Rapidminer Video Tutorial I show the user how to use the web crawling and text mining operators to download 4 web pages, build a word frequency list, and then check out the similarities between the web sites.
Hat tip to Neil at Vancouver.blogspot.com and the Rapid-I team.
Advanced ETL using Macros and Loops
In this video I share some tips and tricks on how to RapidMiner Macros and Loops. At first, these concepts might be a bit tricky but they are WELL WORTH LEARNING! Note my happy emphasis!
Tips and Tricks in RapidMiner
Finally got around to making a few new videos. This one is about using the Union operator and it saved me from a Sunday night of hell. Hope you find this useful!
Balancing Data in RapidMiner
Posted another tips and tricks video using Rapidminer. This one is about how to balance and sample data from a large data set (10 million rows).
You can download the original CSV file here: CreditCardData.csv « This link is dead. I can’t find the XLS.
RapidMiner Livestream 1
RapidMiner Livestream 2
RapidMiner Livestream 3
RapidMiner Livestream 4
WordClouds in RapidMiner Using R
RapidMiner & Python in Production on RapidMiner Server
Continuing my RapidMiner Server series. In this video I show you how to save a RapidMiner Studio process to RapidMiner Server. Then configure RapidMiner Server and a Job Agent to use Python. The result is a productionalization of a simple auto posting Twitter process.
Text Mining Federal Reserve Meeting Minutes
I made another video for RapidMiner last week and this time it’s about Text Mining Federal Reserve Meeting minutes. In the video I show how you cluster words and use association rules/item set mining to find interesting word associations. There’s some good stuff in those meeting minutes.
Parameter Optimization in RapidMiner (no video)
In several of my video tutorials I assign different parameters for my learning model “on the fly.” Of course the question any astute reader/viewer should ask is, “why did you choose those parameters instead of another combination?”
That’s a great question and the answer is, “well I just choose those parameters to illustrate my point for the video.” While this answer is not at all satisfying to the astute reader/viewer, it does lead us to ask the most important question of all, “what are the right parameters to choose?”
This can be answered very well if you were to use Rapidminer’s Parameter Optimization operator in your initial data discovery phase. This operator allows you to choose some or all of the parameters in your experiment and iterate different values for them to meet some specific requirement on your part (i.e. performance).
For example, if you were using the Neural Net operator and didn’t know what to set your learning and momentum parameters to, to get the best classification accuracy, you would use the Parameter Optimization operator to interate different combinations of those parameters to find the best accuracy.
Once the Parameter Optimization operator determines those values, you can input them into your experiment and truly optimize your model for performance! See below for an actual output from a parameter optimization model I’m working on. You can see that Rapidminer indicated that momentum of 0.3 and a learning rate of 0.6 was the best parameter settings to maximize the accuracy rate and minimize the classification error.
While is operator is a fantastic feature (they got evolutionary optimizers too!) for us data modelers, its a massive computer resource suck. I would advise anyone using this operator to have a very powerful server or computer, with oodles of memory, to run your iterations.
Sample Parameter Optimization Example in RapidMiner (no video)
Below is a simple parameter optimization process in Rapidminer using the Iris data set. Download the TXT file and import it into Rapidminer. Of course, you may use whatever data set you want and switch out the learner. Make sure to update the parameter optimization operator parameters. :)
Extending GIS Data in RapidMiner (no video)
My talented coworker and GIS expert, Balázs Bárány, made some amazing progress on extending GIS in RapidMiner. Using Groovy Script, and the Execute Script operator in RapidMiner, he was able to import a GIS shapefile.
I find this incredibly cool because as a former Civil Engineer, I spent many hours extracting traverses from survey points (i.e latitude and longitude), calculating drainage areas from polygons, and using environmental related data for reports.
To show you want can be done, I downloaded GIS information for the Netherlands from GeoFabrik to test this out.
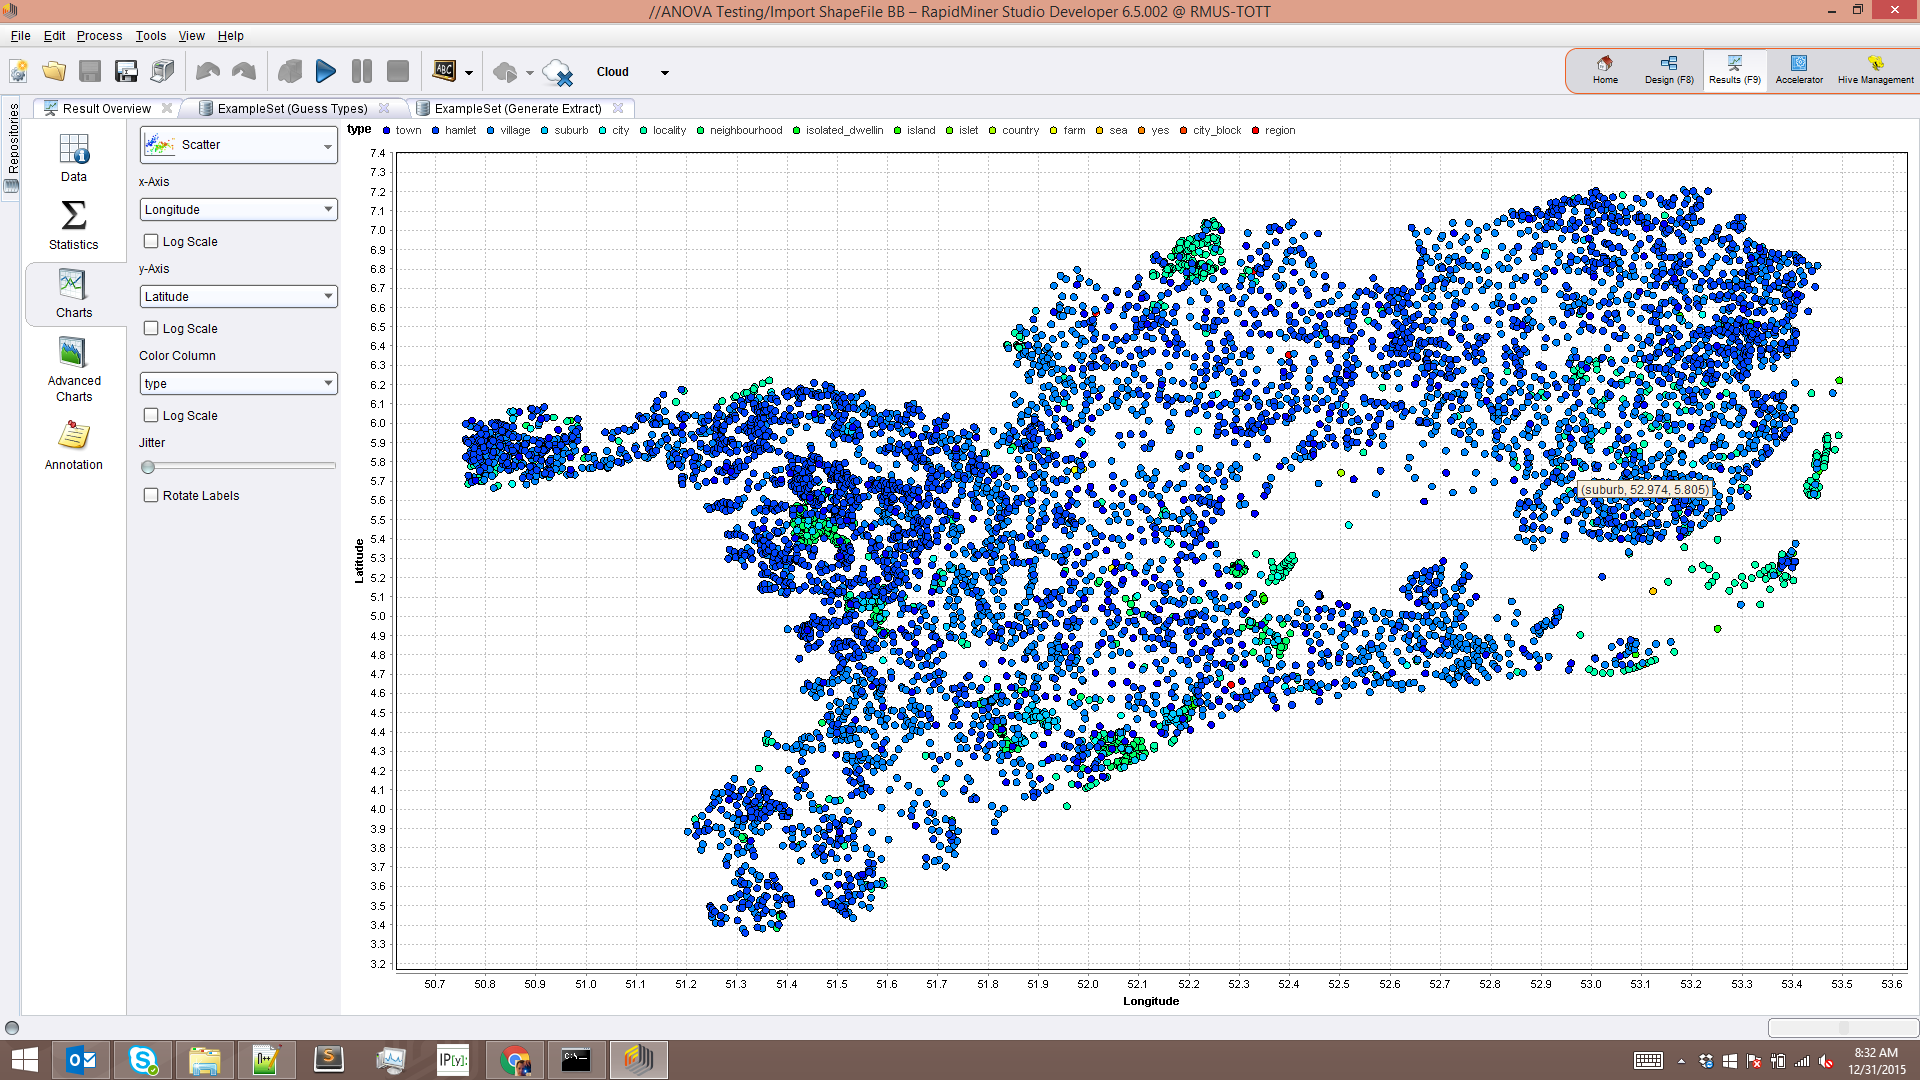
Just follow his write up on installing the GeoScript Java libraries and modifying your RapidMiner Studio startup script. If you need the new Groovy Script Jar file, you can get it here.
RapidMiner Text Mining Resources
Just some Text Mining resources in RapidMiner that I found cool, helpful, and interesting. This list will be updated as I find more links.
-
Using NLTK and Text Blob python packages
-
Fix spelling mistakes using Text Blog python package
-
Splitting text into sentences inside RapidMiner
-
Building a dictionary based sentiment model in RapidMiner
-
Text processing customer reviews using the Aylien extension
Fix Spelling Mistakes with Python and RapidMiner (no video)
The RapidMiner Community has some really talented Data Scientists. I recently came across a response by Unicorn lionelderkrikor on how to fix general spelling errors using a bit of Python and RapidMiner.
The goal here was to correct things like “verrry goood!” to “very good!”, or “yah!” to “yes!” Typical annoying text processing tasks that every data scientist needs to do time and time again. RapidMiner was used to do the heavy text processing and Lionel used the Python Textblob library to write two simple functions that corrected the majority of mistakes.
Note, I said majority. In some cases if you wrote ‘verrrrrrrrrrrrrrrrrrrrrrrrrrrrrryyyyyyyyyyyyyyyyyy goooooooooooooooooooooooooddddddddddddd’, the Textblob library couldn’t figure it out, and I completely understand it. If you wrote that above in a Tweet, I’d take away your smartphone and spank you with it.
Check out the Community post and grab Lionel’s XML to play with it yourself.
Rest API’s & RapidMiner for Text Mining
- Online is becoming the ‘goto’ place for customers to interact with a company
- Number 1 reason to access chat is to get a quick answer in an emergency
- RapidMiner uses the Drift API and help user to navigate to the answer
- Retrieves online chat from REST API > Text Processes conversation > Categorizes via LDA > pushes to RapidMiner Server
- Need extensions: Text Processing / Operator Toolbox / Web Mining
- API’s respond in JSON Arrays
- Use Online JSON Viewer to Pretty Print responses
- Store auth tokens as a macro in RapidMiner
- Get Page is not a REST API tool, it just queries pages on the internet BUT it has some handy abilities
- Get Pages > JSON to Data operator.
- Get the JSON array from Get Pages and convert it via JSON to Data operator
Using the Multiply Data Operator in RapidMiner (no video)
I often use the Multiply operator to make copies of my data set and feed it into different learners. I do this because sometimes I don’t know if a Neural Net operator, or a SVM operator, give me better performance. Once I know which operator performs my task better, I then use the parameter optimization process to see if I can squeeze more accuracy out it.
The sample process below uses the Iris data set, just switch it out with your data set and enjoy.
Striping carriage returns, spaces, and tabs using Python and RapidMiner (code)
I’ve been working on some Python code for a RapidMiner process. What I want to do is simplify my Instagram Hashtag Tool and make it go faster.
Part of that work is extracting the Instagram comments for text processing. I ran into utter hell trying to export those comments into a CSV file that RapidMiner could read. It was exporting the data just fine but wrapping the comment into carriage returns. For some strange reason, RapidMiner can not read carriage returned data in a cell. It can only read the first line. Luckily with the help of some users I managed to work around and find a solution on my end. DO all the carriage return striping on my end before export.
The trick is to strip all carriage returns, spaces, tabs, etc using the regular expression ’s’, then replace the stripped items with a space like this ’ ’ in place. While this isn’t elegant, it had to be done because Instagram comment are so messy to begin with.
#!/usr/bin/env python
# -*- coding: utf-8 -*-

import pandas as pd
import json
from pprint import pprint
import csv
import re

df = pd.read_json('https://www.instagram.com/explore/tags/film/?__a=1')

name = df['graphql']['hashtag']['name']

hashtag_count = df['graphql']['hashtag']['edge_hashtag_to_media']['count']

count_list = []
likes = df['graphql']['hashtag']['edge_hashtag_to_media']['edges']
for i in likes:
    add = (df['graphql']['hashtag']['name'], df['graphql']['hashtag']['edge_hashtag_to_media']['count'], i['node']['id'], i['node']['edge_liked_by']['count'], i['node']['display_url'])
    count_list.append(add)
print(count_list)

count_out = pd.DataFrame(count_list)
count_out.columns = ['hashtag', 'count', 'user_id', 'likes', 'image_url']

# This just exports out a CSV with the above data. Plan is to use this in a RM process
count_out.to_csv('out.csv')

# Now comes the hard part, preparing the comments for a RM Process.
# This is where the carriage returns killed me for hours

text_export = []
rawtext = df['graphql']['hashtag']['edge_hashtag_to_media']['edges']
for i in rawtext:
    rawtext = i['node']['edge_media_to_caption']['edges']
    #print(rawtext)
    for j in rawtext:
        final_text = j['node']['text']
        df['final_text'] = j['node']['text']
        text_export.append(final_text)
        print(df['final_text'])

text_out = pd.DataFrame(text_export)

#This is the key, I had to strip everything using s and replacing it with a space via ' '

text_out.replace(r's',' ', regex=True, inplace=True)

text_out.columns = ['comment']

text_out.to_csv('out2.csv', line_terminator='rn')
Wordclouds in RapidMiner and R
There was a question from the RapidMiner Community on how to make a word clouds in RapidMiner using R. It’s really easy.
First, you’ll need to make sure you have the Execute R extension installed and configured, then you need to download the “wordcloud” and “RColorBrewer” packages from R Cran Repository.
Finally, grab this sample XML and pop it in your RapidMiner Studio. Note: I saved the image to my desktop, you’ll have to repath it to where you want to save the PNG.
<?xml version="1.0" encoding="UTF-8"?><process version="8.2.001">
<context>
<input/>
<output/>
<macros/>
</context>
<operator activated="true" class="process" compatibility="8.2.001" expanded="true" name="Process">
<process expanded="true">
<operator activated="true" class="social_media:search_twitter" compatibility="8.1.000" expanded="true" height="68" name="Search Twitter" width="90" x="45" y="34">
<parameter key="connection" value="Twitter"/>
<parameter key="query" value="rapidminer"/>
</operator>
<operator activated="true" class="select_attributes" compatibility="8.2.001" expanded="true" height="82" name="Select Attributes" width="90" x="179" y="34">
<parameter key="attribute_filter_type" value="single"/>
<parameter key="attribute" value="Text"/>
</operator>
<operator activated="true" class="nominal_to_text" compatibility="8.2.001" expanded="true" height="82" name="Nominal to Text" width="90" x="313" y="34">
<parameter key="attribute_filter_type" value="single"/>
<parameter key="attribute" value="Text"/>
</operator>
<operator activated="true" class="text:process_document_from_data" compatibility="8.1.000" expanded="true" height="82" name="Process Documents from Data" width="90" x="447" y="34">
<parameter key="prune_method" value="percentual"/>
<list key="specify_weights"/>
<process expanded="true">
<operator activated="true" class="text:tokenize" compatibility="8.1.000" expanded="true" height="68" name="Tokenize" width="90" x="112" y="34"/>
<connect from_port="document" to_op="Tokenize" to_port="document"/>
<connect from_op="Tokenize" from_port="document" to_port="document 1"/>
<portSpacing port="source_document" spacing="0"/>
<portSpacing port="sink_document 1" spacing="0"/>
<portSpacing port="sink_document 2" spacing="0"/>
</process>
</operator>
<operator activated="true" class="text:wordlist_to_data" compatibility="8.1.000" expanded="true" height="82" name="WordList to Data" width="90" x="581" y="85"/>
<operator activated="true" class="select_attributes" compatibility="8.2.001" expanded="true" height="82" name="Select Attributes (2)" width="90" x="715" y="85">
<parameter key="attribute_filter_type" value="subset"/>
<parameter key="attributes" value="word|total"/>
</operator>
<operator activated="true" class="r_scripting:execute_r" compatibility="8.1.000" expanded="true" height="82" name="Execute R" width="90" x="849" y="85">
<parameter key="script" value="# rm_main is a mandatory function, # the number of arguments has to be the number of input ports (can be none) rm_main = function(data) { 	library("wordcloud") 	library("RColorBrewer") 	 	png("C:\Users\TomOtt\Desktop\wordcloud.png", width=1280,height=800) 	wordcloud(words = data$word, freq = data$total, min.freq = 1, max.words=200, random.order=FALSE, rot.per=0.35, colors=brewer.pal(8, "Dark2")) 	dev.off() 	 	return (data) } "/>
</operator>
<connect from_op="Search Twitter" from_port="output" to_op="Select Attributes" to_port="example set input"/>
<connect from_op="Select Attributes" from_port="example set output" to_op="Nominal to Text" to_port="example set input"/>
<connect from_op="Nominal to Text" from_port="example set output" to_op="Process Documents from Data" to_port="example set"/>
<connect from_op="Process Documents from Data" from_port="word list" to_op="WordList to Data" to_port="word list"/>
<connect from_op="WordList to Data" from_port="example set" to_op="Select Attributes (2)" to_port="example set input"/>
<connect from_op="Select Attributes (2)" from_port="example set output" to_op="Execute R" to_port="input 1"/>
<connect from_op="Execute R" from_port="output 1" to_port="result 1"/>
<portSpacing port="source_input 1" spacing="0"/>
<portSpacing port="sink_result 1" spacing="0"/>
<portSpacing port="sink_result 2" spacing="0"/>
</process>
</operator>
</process>
Installing RapidMiner on AWS
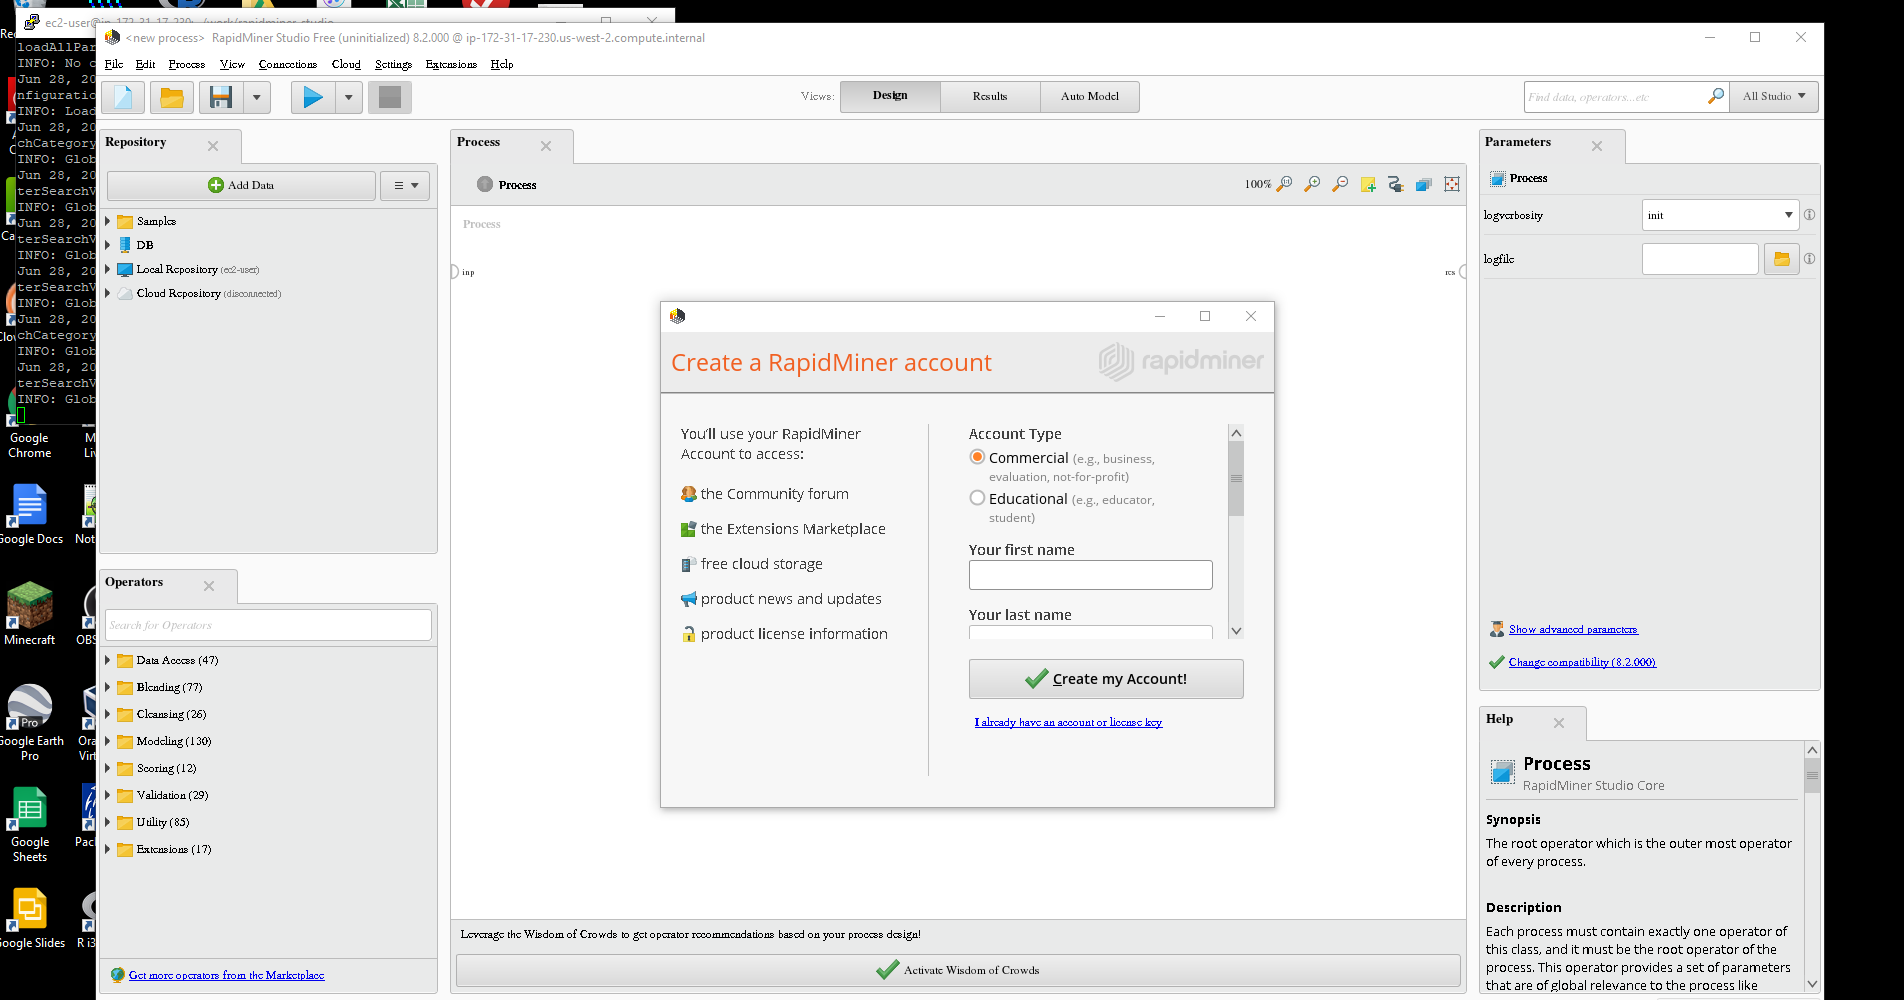
or a project I had to spin up an EC2 instance and install RapidMiner Studio there. I needed a static IP to make some connections to a database across the ocean and figured AWS was the easiest route. It turned out not to be that easy.
I ended having to install Java 8, RapidMiner Studio, X11 Windows, XMING server, and use Putty to bring it all together. The end result, I had to port forward X11 to my Windows Laptop. It works but it’s a bit complex and slow.
Spin up an AWS instance
First you have to spin up an instance on AWS. I chose a bare bones Linux AMI and installed Java 8 on it. You don’t need to select an static IP but make sure create the appropriate security group and enable port 22 in your security group or else Putty won’t work.
Then install RapidMiner Studio. I used the latest (version 8.2) Linux version and downloaded it using the ‘wget’ command. I saved it into a folder called ‘work’. You can save it anywhere but make sure to unzip it. It will create a RapidMiner-Studio folder.
Connect via Putty
I won’t get into details here on how to connect Putty to AWS but here is a great tutorial from Amazon.
Connect and then install the X11 libraries. I found how to do it here. Also, you’ll have to enable X11 port forwarding in Putty, see the article on how to toggle it on.
Then logoff.
Install XMING Server
You’re going to need XMING Server if you’re coming from Windows. You can get it here. Install it and launch it.
Connect to your AWS instance
Using Putty, connect back to AWS instance. Once there, test your XMING and X11 installation by typing ‘xeyes’. If everything is installed correctly, you should get a window pop up with googly eyes.
Then navigate to where you install RapidMiner Studio, find the RapidMiner-Studio.sh file and execute it doing ‘./RapidMiner-Studio.sh’
If everything is correct, RapidMiner Studio should pop up like the image above.
Done. Put a fork in me.
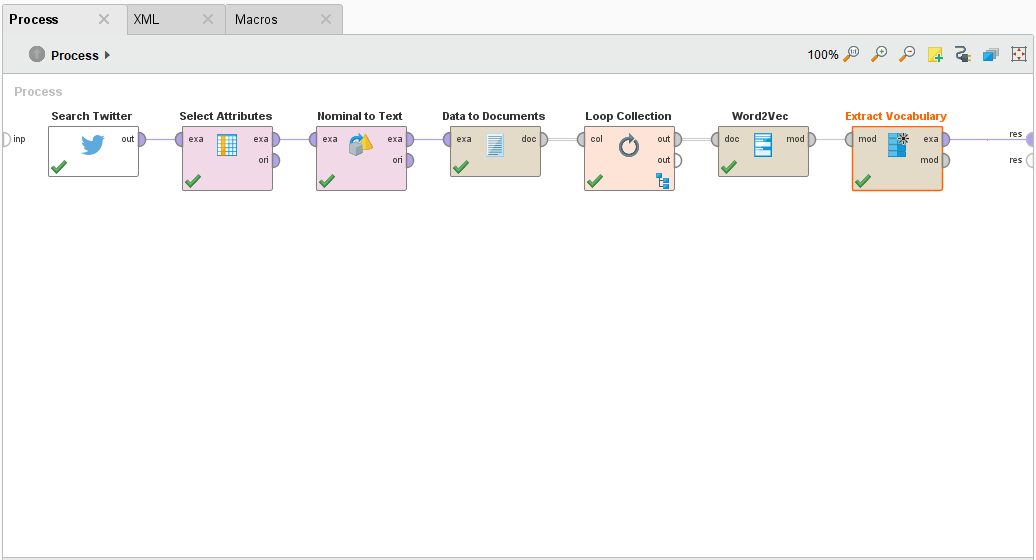
Word to Vec (Word2Vec) in RapidMiner
This is an example process of how to use Word2Vec in RapidMiner with the Search Twitter operator. For more information check out this post on the community.
I’ll be going over this in a bit more detail at my next live stream here.
		<?xml version="1.0" encoding="UTF-8"?><process version="8.1.001">
		  <context>
		    <input/>
		    <output/>
		    <macros/>
		  </context>
		  <operator activated="true" class="process" compatibility="8.1.001" expanded="true" name="Process">
		    <process expanded="true">
		      <operator activated="true" class="social_media:search_twitter" compatibility="8.1.000" expanded="true" height="68" name="Search Twitter" width="90" x="45" y="34">
		        <parameter key="connection" value="Twitter - Studio Connection"/>
		        <parameter key="query" value="rapidminer"/>
		        <parameter key="locale" value="en"/>
		      </operator>
		      <operator activated="true" class="select_attributes" compatibility="8.1.001" expanded="true" height="82" name="Select Attributes" width="90" x="45" y="136">
		        <parameter key="attribute_filter_type" value="single"/>
		        <parameter key="attribute" value="Text"/>
		        <parameter key="include_special_attributes" value="true"/>
		      </operator>
		      <operator activated="true" class="nominal_to_text" compatibility="8.1.001" expanded="true" height="82" name="Nominal to Text" width="90" x="45" y="238"/>
		      <operator activated="true" class="text:data_to_documents" compatibility="8.1.000" expanded="true" height="68" name="Data to Documents" width="90" x="246" y="34">
		        <list key="specify_weights"/>
		      </operator>
		      <operator activated="true" class="loop_collection" compatibility="8.1.001" expanded="true" height="82" name="Loop Collection" width="90" x="246" y="136">
		        <process expanded="true">
		          <operator activated="true" class="text:transform_cases" compatibility="8.1.000" expanded="true" height="68" name="Transform Cases" width="90" x="112" y="34"/>
		          <operator activated="true" class="text:tokenize" compatibility="8.1.000" expanded="true" height="68" name="Tokenize" width="90" x="581" y="34"/>
		          <connect from_port="single" to_op="Transform Cases" to_port="document"/>
		          <connect from_op="Transform Cases" from_port="document" to_op="Tokenize" to_port="document"/>
		          <connect from_op="Tokenize" from_port="document" to_port="output 1"/>
		          <portSpacing port="source_single" spacing="0"/>
		          <portSpacing port="sink_output 1" spacing="0"/>
		          <portSpacing port="sink_output 2" spacing="0"/>
		        </process>
		      </operator>
		      <operator activated="true" class="word2vec:Word2Vec_Learner" compatibility="1.0.000" expanded="true" height="68" name="Word2Vec " width="90" x="447" y="34"/>
		      <operator activated="true" class="word2vec:Get_Vocabulary" compatibility="1.0.000" expanded="true" height="82" name="Extract Vocabulary" width="90" x="581" y="34">
		        <parameter key="Get Full Vocabulary" value="true"/>
		        <parameter key="Take Random Words" value="false"/>
		        <parameter key="Number of Words to Pull" value="10"/>
		      </operator>
		      <connect from_op="Search Twitter" from_port="output" to_op="Select Attributes" to_port="example set input"/>
		      <connect from_op="Select Attributes" from_port="example set output" to_op="Nominal to Text" to_port="example set input"/>
		      <connect from_op="Nominal to Text" from_port="example set output" to_op="Data to Documents" to_port="example set"/>
		      <connect from_op="Data to Documents" from_port="documents" to_op="Loop Collection" to_port="collection"/>
		      <connect from_op="Loop Collection" from_port="output 1" to_op="Word2Vec " to_port="doc"/>
		      <connect from_op="Word2Vec " from_port="mod" to_op="Extract Vocabulary" to_port="mod"/>
		      <connect from_op="Extract Vocabulary" from_port="exa" to_port="result 1"/>
		      <portSpacing port="source_input 1" spacing="0"/>
		      <portSpacing port="sink_result 1" spacing="0"/>
		      <portSpacing port="sink_result 2" spacing="0"/>
		    </process>
		  </operator>
		</process>
Extract OpenStreetMap Data in RapidMiner
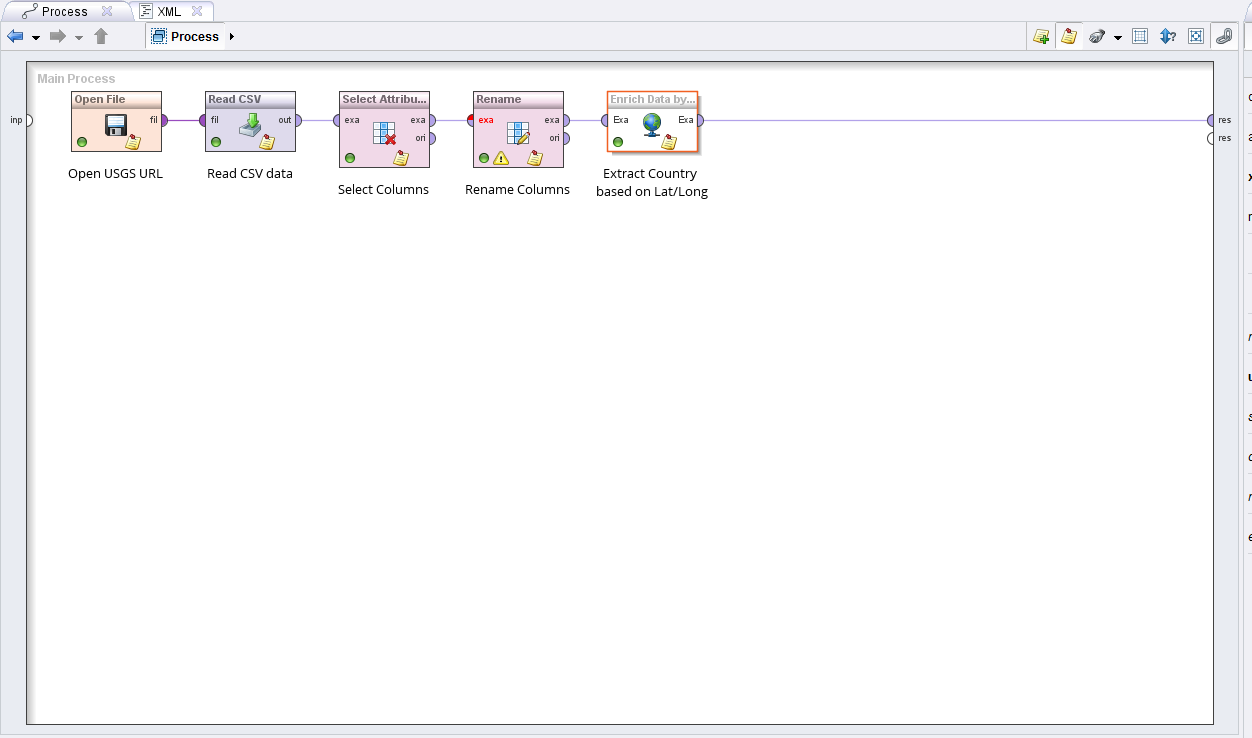
A few weeks ago I wanted to play with the Enrich by Webservice operator. The operator is part of the RapidMiner Web Mining extension and is accessible through the Marketplace. I wanted to do reverse lookups based on latitude and longitude. In my searching I came across this post on how to do it using XPath and via Google. That post was most informative and I used it as a starting point for my process building. I wanted to do the same thing but use OpenStreetMaps. Why OSM? OSM is an open source database of Geographic Inforation Systems (GIS) and is rich with data. Plus, it’s a bit easier to use than Google.
After a few minutes of tinkering, I was successful. I built a process to go out to the USGS Eartquake site, grab the current CSV, load it, and then do a reverse lookup using the latitude and longitude. The process then creates a column with the country via the XPath of “//reversegeocode/addressparts/country/text().”
Here’s what the process looks like:
Here’s the XML of the process:
<?xml version="1.0" encoding="UTF-8"?><process version="7.6.001">
<context>
<input/>
<output/>
<macros/>
</context>
<operator activated="true" class="process" compatibility="7.6.001" expanded="true" name="Process">
<process expanded="true">
<operator activated="true" class="open_file" compatibility="7.6.001" expanded="true" height="68" name="Open File" width="90" x="45" y="30">
<parameter key="resource_type" value="URL"/>
<parameter key="filename" value="https://earthquake.usgs.gov/earthquakes/feed/v1.0/summary/2.5_day.csv"/>
<parameter key="url" value="https://earthquake.usgs.gov/earthquakes/feed/v1.0/summary/2.5_day.csv"/>
<description align="center" color="transparent" colored="false" width="126">Open USGS URL</description>
</operator>
<operator activated="true" class="read_csv" compatibility="7.6.001" expanded="true" height="68" name="Read CSV" width="90" x="179" y="30">
<parameter key="column_separators" value=","/>
<list key="annotations"/>
<list key="data_set_meta_data_information"/>
<description align="center" color="transparent" colored="false" width="126">Read CSV data</description>
</operator>
<operator activated="true" class="select_attributes" compatibility="7.6.001" expanded="true" height="82" name="Select Attributes" width="90" x="380" y="30">
<parameter key="attribute_filter_type" value="subset"/>
<parameter key="attributes" value="latitude|longitude|time|mag"/>
<description align="center" color="transparent" colored="false" width="126">Select Columns</description>
</operator>
<operator activated="true" class="rename" compatibility="7.6.001" expanded="true" height="82" name="Rename" width="90" x="514" y="30">
<parameter key="old_name" value="latitude"/>
<parameter key="new_name" value="Latitude"/>
<list key="rename_additional_attributes">
<parameter key="longitude" value="Longitude"/>
</list>
<description align="center" color="transparent" colored="false" width="126">Rename Columns</description>
</operator>
<operator activated="true" class="web:enrich_data_by_webservice" compatibility="7.3.000" expanded="true" height="68" name="Enrich Data by Webservice" width="90" x="648" y="30">
<parameter key="query_type" value="XPath"/>
<list key="string_machting_queries"/>
<list key="regular_expression_queries"/>
<list key="regular_region_queries"/>
<list key="xpath_queries">
<parameter key="ExtractedCountry" value="//reversegeocode/addressparts/country/text()"/>
</list>
<list key="namespaces"/>
<parameter key="assume_html" value="false"/>
<list key="index_queries"/>
<list key="jsonpath_queries"/>
<parameter key="url" value="https://nominatim.openstreetmap.org/reverse?format=xml&lat=<%Latitude%>&lon=<%Longitude%>&zoom=18&addressdetails=1"/>
<list key="request_properties"/>
<description align="center" color="transparent" colored="false" width="126">Extract Country based on Lat/Long</description>
</operator>
<connect from_op="Open File" from_port="file" to_op="Read CSV" to_port="file"/>
<connect from_op="Read CSV" from_port="output" to_op="Select Attributes" to_port="example set input"/>
<connect from_op="Select Attributes" from_port="example set output" to_op="Rename" to_port="example set input"/>
<connect from_op="Rename" from_port="example set output" to_op="Enrich Data by Webservice" to_port="Example Set"/>
<connect from_op="Enrich Data by Webservice" from_port="ExampleSet" to_port="result 1"/>
<portSpacing port="source_input 1" spacing="0"/>
<portSpacing port="sink_result 1" spacing="0"/>
<portSpacing port="sink_result 2" spacing="0"/>
</process>
</operator>
</process>
Note: Updated RapidMiner XML with new USGS URL on 2017-09-07
Calculating GeoDistance in RapidMiner with Python
I showed how you can use the Enrich by Webservice operator and OpenStreetMaps to do reverse geocoding lookups. This post will show how to calculate Geospatial distances between two latitude and longitude points. First using a RapidMiner and then using the GeoPy Python module.
This was a fun because it touched on my civil engineering classes. I used to calculate distances from latitude and longitude in my land surveying classes.
My first step was to select a “home” location, which was 1 Penn Plaza, NY NY. Then I downloaded the latest list of earthquakes from the USGS website. The last step was to calculate the distance from home to each earthquake location.
The biggest time suck for me was building all the formulas in RapidMiner’s Generate Attribute (GA) operator. That took about about 15 minutes. Then I had to backcheck the calculations with a website to make sure they matched. RapidMiner excelled in the speed of building and analyzing this process but I did notice the results were a bit off from the GeoPy python process.
There was a variance of about +/- 4km in each distance. This is because I hard coded in the earth’s diameter as 6371000 km for the RapidMiner process, but the diameter of the Earth changes based on your location. This is because the earth isn’t a sphere but more of an ellipsoid and the diameter isn’t uniform. The GeoPy great_circle calculation accounts for this by adjusting the calculation.
For a proof of concept, both work just fine.
There were a few snags in my python code that took me longer to finish and I chalk this up to my novice ability at writing python. I didn’t realize that I had to create a tuple out of the lat/long columns and then use a for loop to iterate over the entire tuple list. But this was something that my friend solved in 5 minutes. Otherwise than that, the python code works well. Here’s the XML of the process:
<?xml version="1.0" encoding="UTF-8" standalone="no"?>
<process version="6.5.002">
<context>
<input/>
<output/>
<macros/>
</context>
<operator activated="true" class="process" compatibility="6.5.002" expanded="true" name="Process">
<process expanded="true">
<operator activated="true" class="open_file" compatibility="6.5.002" expanded="true" height="60" name="Open File" width="90" x="45" y="30">
<parameter key="resource_type" value="URL"/>
<parameter key="url" value="https://earthquake.usgs.gov/earthquakes/feed/v1.0/summary/2.5_day.csv"/>
<description align="center" color="transparent" colored="false" width="126">Open Earthquake USGS URL</description>
</operator>
<operator activated="true" class="read_csv" compatibility="6.5.002" expanded="true" height="60" name="Read CSV" width="90" x="179" y="30">
<parameter key="column_separators" value=","/>
<list key="annotations"/>
<list key="data_set_meta_data_information"/>
<description align="center" color="transparent" colored="false" width="126">Read CSV file</description>
</operator>
<operator activated="true" class="select_attributes" compatibility="6.5.002" expanded="true" height="76" name="Select Attributes" width="90" x="313" y="30">
<parameter key="attribute_filter_type" value="subset"/>
<parameter key="attributes" value="latitude|longitude|mag"/>
<description align="center" color="transparent" colored="false" width="126">Select Magnitude, Lat, and Long</description>
</operator>
<operator activated="true" class="filter_examples" compatibility="6.5.002" expanded="true" height="94" name="Filter Examples" width="90" x="447" y="30">
<list key="filters_list">
<parameter key="filters_entry_key" value="mag.gt.4"/>
</list>
<description align="center" color="transparent" colored="false" width="126">Filter for quakes &gt; mag 4</description>
</operator>
<operator activated="true" class="rename" compatibility="6.5.002" expanded="true" height="76" name="Rename" width="90" x="581" y="30">
<parameter key="old_name" value="latitude"/>
<parameter key="new_name" value="Latitude"/>
<list key="rename_additional_attributes">
<parameter key="longitude" value="Longitude"/>
</list>
<description align="center" color="transparent" colored="false" width="126">Rename columns</description>
</operator>
<operator activated="true" class="generate_attributes" compatibility="6.5.002" expanded="true" height="76" name="Generate Attributes" width="90" x="715" y="30">
<list key="function_descriptions">
<parameter key="Rad_Lat" value="Latitude*(pi/180)"/>
<parameter key="Rad_Long" value="Longitude*(pi/180)"/>
<parameter key="Lat_Home" value="40.750938"/>
<parameter key="Long_Home" value="-73.991594"/>
<parameter key="Rad_Lat_Home" value="Lat_Home*(pi/180)"/>
<parameter key="Rad_Long_Home" value="Long_Home*(pi/180)"/>
<parameter key="Rad_Diff_Lat" value="(Latitude-Lat_Home)*(pi/180)"/>
<parameter key="Rad_Diff_Long" value="(Longitude-Long_Home)*(pi/180)"/>
<parameter key="a" value="(sin(Rad_Diff_Lat/2))^2 + cos(Rad_Lat) * cos(Rad_Lat_Home) * (sin(Rad_Diff_Long/2))^2"/>
<parameter key="c" value="2 * atan2(sqrt(a), sqrt(1-a) )"/>
<parameter key="distance_km" value="(6371000*c)/1000"/>
<parameter key="distance_miles" value="distance_km*0.621371"/>
</list>
<description align="center" color="transparent" colored="false" width="126">Make lots of calculations<br/></description>
</operator>
<connect from_op="Open File" from_port="file" to_op="Read CSV" to_port="file"/>
<connect from_op="Read CSV" from_port="output" to_op="Select Attributes" to_port="example set input"/>
<connect from_op="Select Attributes" from_port="example set output" to_op="Filter Examples" to_port="example set input"/>
<connect from_op="Filter Examples" from_port="example set output" to_op="Rename" to_port="example set input"/>
<connect from_op="Rename" from_port="example set output" to_op="Generate Attributes" to_port="example set input"/>
<connect from_op="Generate Attributes" from_port="example set output" to_port="result 1"/>
<portSpacing port="source_input 1" spacing="0"/>
<portSpacing port="sink_result 1" spacing="0"/>
<portSpacing port="sink_result 2" spacing="0"/>
</process>
</operator>
</process>
Here’s the python process:
        #!/usr/bin/python
        import pandas as pd
        from geopy.geocoders import Nominatim
        from geopy.distance import great_circle

        geolocator = Nominatim()

        location = geolocator.geocode("1 Penn Plaza, NY, NY")
        home = (location.latitude, location.longitude) #Set Home Location

        earthquake = pd.read_csv('https://earthquake.usgs.gov/earthquakes/feed/v1.0/summary/2.5_day.csv') #Read CSV file

        selection = (earthquake['mag'] >= 4) #Filter for earthquakes > mag 4

        earthquake = earthquake[selection].dropna(how = 'any', subset = ['latitude', 'longitude']).drop(['time', 'depth', 'mag', 'magType', 'nst','gap','dmin', 'rms','net', 'id','updated','place','type'], axis=1)

        earthquake = earthquake.convert_objects(convert_numeric=True)

        earthquake.describe(include='all') #not necessary but I like to see a description of the data I'm pushing downstream

        earthquake['combined'] = zip(earthquake.latitude, earthquake.longitude) #create tuple from pandas dataframe

        print earthquake.combined #double check the list

        print [great_circle(home, (lt,lng)) for (lt,lng) in earthquake.combined] #brackets are a short form of loop
Mean Reversion Trading in RapidMiner
Lately I’ve been think about becoming more active in trading again. I was reviewing some strategies and decided to recreate a mean reversion trading process in RapidMiner. I found a mean reversion trading stategy that uses Python here and just recreated it in RapidMiner.
The Process
The process is quite simple. You do the following:
- Load in stock quote data via CSV;
- Calculate daily returns;
- Calculate a 20 day moving average;
- Calculate a rolling 90 day standard deviation;
- Generate Trading Criteria per the article;
- Wrap it all together and look at the Buy vs Hold and Buy Signals.
Mind you, this doesn’t include commission costs and slippage. I suspect that once I add that in, the Buy and Hold strategy will be the best.
<?xml version="1.0" encoding="UTF-8"?><process version="8.1.001">
<context>
<input/>
<output/>
<macros/>
</context>
<operator activated="true" class="process" compatibility="8.1.001" expanded="true" name="Process">
<parameter key="encoding" value="SYSTEM"/>
<process expanded="true">
<operator activated="true" class="subprocess" compatibility="8.1.001" expanded="true" height="82" name="Load Data" width="90" x="45" y="34">
<process expanded="true">
<operator activated="true" class="read_csv" compatibility="8.1.000" expanded="true" height="68" name="Read Downloaded S&P500" width="90" x="45" y="34">
<parameter key="csv_file" value="C:\Users\TomOtt\Downloads\INTC.csv"/>
<parameter key="column_separators" value=","/>
<parameter key="first_row_as_names" value="false"/>
<list key="annotations">
<parameter key="0" value="Name"/>
</list>
<parameter key="encoding" value="windows-1252"/>
<list key="data_set_meta_data_information">
<parameter key="0" value="Date.true.polynominal.attribute"/>
<parameter key="1" value="Open.true.real.attribute"/>
<parameter key="2" value="High.true.real.attribute"/>
<parameter key="3" value="Low.true.real.attribute"/>
<parameter key="4" value="Close.true.real.attribute"/>
<parameter key="5" value="Adj Close.true.real.attribute"/>
<parameter key="6" value="Volume.true.real.attribute"/>
</list>
<description align="center" color="transparent" colored="false" width="126">Due to Yahoo changes, must download CSV file manually for now!</description>
</operator>
<operator activated="true" class="series:lag_series" compatibility="7.4.000" expanded="true" height="82" name="Lag Series" width="90" x="179" y="34">
<list key="attributes">
<parameter key="Close" value="1"/>
</list>
</operator>
<operator activated="true" class="generate_attributes" compatibility="8.1.001" expanded="true" height="82" name="Returns" width="90" x="313" y="34">
<list key="function_descriptions">
<parameter key="Returns" value="(Close-Open)/Open"/>
</list>
</operator>
<operator activated="true" class="select_attributes" compatibility="8.1.001" expanded="true" height="82" name="Select Attributes for ETL" width="90" x="447" y="34">
<parameter key="attribute_filter_type" value="single"/>
<parameter key="attribute" value="^GSPC_CLOSE-1"/>
<parameter key="invert_selection" value="true"/>
</operator>
<operator activated="true" class="series:moving_average" compatibility="7.4.000" expanded="true" height="82" name="MA 20 DAY" width="90" x="581" y="34">
<parameter key="attribute_name" value="Close"/>
<parameter key="window_width" value="20"/>
</operator>
<operator activated="true" class="series:windowing" compatibility="7.4.000" expanded="true" height="82" name="Window for 90 Day STDEV" width="90" x="715" y="34">
<parameter key="window_size" value="90"/>
<parameter key="label_attribute" value="Close"/>
</operator>
<operator activated="true" class="generate_aggregation" compatibility="8.1.001" expanded="true" height="82" name="Calc STD Dev for 90 day window" width="90" x="849" y="34">
<parameter key="attribute_name" value="StDev"/>
<parameter key="attribute_filter_type" value="regular_expression"/>
<parameter key="attributes" value="Log Returns-0|Log Returns-1|Log Returns-2|Log Returns-3|Log Returns-4"/>
<parameter key="regular_expression" value="Close\-[0-9]"/>
<parameter key="aggregation_function" value="standard_deviation"/>
</operator>
<operator activated="true" class="select_attributes" compatibility="8.1.001" expanded="true" height="82" name="Select Attributes" width="90" x="983" y="34">
<parameter key="attribute_filter_type" value="subset"/>
<parameter key="attributes" value="Close-0|Date-0|High-0|Low-0|Open-0|StDev|Volume-0|average(Close)-0|Log Returns-0|Returns-0"/>
</operator>
<operator activated="true" class="rename" compatibility="8.1.001" expanded="true" height="82" name="Rename a bunch of stuff" width="90" x="1117" y="34">
<parameter key="old_name" value="Date-0"/>
<parameter key="new_name" value="Date"/>
<list key="rename_additional_attributes">
<parameter key="Close-0" value="Close"/>
<parameter key="High-0" value="High"/>
<parameter key="Returns-0" value="Returns"/>
<parameter key="Volume-0" value="Volume"/>
<parameter key="Low-0" value="Low"/>
<parameter key="Open-0" value="Open"/>
<parameter key="average(Close)-0" value="MA20"/>
<parameter key="StDev" value="90daySTDEV"/>
</list>
</operator>
<operator activated="true" class="nominal_to_date" compatibility="8.1.001" expanded="true" height="82" name="Convert dates" width="90" x="1251" y="34">
<parameter key="attribute_name" value="Date"/>
<parameter key="date_format" value="yyyy-MM-dd"/>
</operator>
<operator activated="true" class="series:lag_series" compatibility="7.4.000" expanded="true" height="82" name="Lag Low" width="90" x="1385" y="34">
<list key="attributes">
<parameter key="Low" value="1"/>
</list>
</operator>
<operator activated="true" class="replace_missing_values" compatibility="8.1.001" expanded="true" height="103" name="Replace Missing Values" width="90" x="1519" y="34">
<parameter key="attribute_filter_type" value="value_type"/>
<parameter key="value_type" value="numeric"/>
<parameter key="default" value="zero"/>
<list key="columns"/>
</operator>
<connect from_op="Read Downloaded S&P500" from_port="output" to_op="Lag Series" to_port="example set input"/>
<connect from_op="Lag Series" from_port="example set output" to_op="Returns" to_port="example set input"/>
<connect from_op="Returns" from_port="example set output" to_op="Select Attributes for ETL" to_port="example set input"/>
<connect from_op="Select Attributes for ETL" from_port="example set output" to_op="MA 20 DAY" to_port="example set input"/>
<connect from_op="MA 20 DAY" from_port="example set output" to_op="Window for 90 Day STDEV" to_port="example set input"/>
<connect from_op="Window for 90 Day STDEV" from_port="example set output" to_op="Calc STD Dev for 90 day window" to_port="example set input"/>
<connect from_op="Calc STD Dev for 90 day window" from_port="example set output" to_op="Select Attributes" to_port="example set input"/>
<connect from_op="Select Attributes" from_port="example set output" to_op="Rename a bunch of stuff" to_port="example set input"/>
<connect from_op="Rename a bunch of stuff" from_port="example set output" to_op="Convert dates" to_port="example set input"/>
<connect from_op="Convert dates" from_port="example set output" to_op="Lag Low" to_port="example set input"/>
<connect from_op="Lag Low" from_port="example set output" to_op="Replace Missing Values" to_port="example set input"/>
<connect from_op="Replace Missing Values" from_port="example set output" to_port="out 1"/>
<portSpacing port="source_in 1" spacing="0"/>
<portSpacing port="sink_out 1" spacing="0"/>
<portSpacing port="sink_out 2" spacing="0"/>
<description align="center" color="yellow" colored="false" height="174" resized="false" width="180" x="24" y="231">The goal is to pull this data from a database in the future.<br/><br/>The database will be populated with stock data from the Nasdaq automatically overnight using EOD</description>
</process>
<description align="center" color="transparent" colored="false" width="126">Load CSV data</description>
</operator>
<operator activated="true" class="generate_attributes" compatibility="8.1.001" expanded="true" height="82" name="Generate Trading Signal" width="90" x="179" y="34">
<list key="function_descriptions">
<parameter key="Criteria1" value="if((Open<[Low-1]) && (Open-[Low-1])<-[90daySTDEV],1,0)"/>
<parameter key="Criteria2" value="if(Open>MA20,1,0)"/>
<parameter key="Signal" value="if(([Criteria1]+[Criteria2])==2,1,0)"/>
</list>
</operator>
<operator activated="true" class="select_attributes" compatibility="8.1.001" expanded="true" height="82" name="Select Final Col" width="90" x="313" y="34">
<parameter key="attribute_filter_type" value="subset"/>
<parameter key="attributes" value="Close|Date|Signal|Returns"/>
</operator>
<operator activated="true" class="multiply" compatibility="8.1.001" expanded="true" height="82" name="Multiply (2)" width="90" x="447" y="34"/>
<operator activated="true" class="subprocess" compatibility="8.1.001" expanded="true" height="103" name="Cum Sum of Returns" width="90" x="581" y="34">
<process expanded="true">
<operator activated="true" class="multiply" compatibility="8.1.001" expanded="true" height="103" name="Multiply (3)" width="90" x="112" y="34"/>
<operator activated="true" class="series:integrate_series" compatibility="7.4.000" expanded="true" height="82" name="All Signals" width="90" x="447" y="289">
<parameter key="attribute_name" value="Returns"/>
</operator>
<operator activated="true" class="filter_examples" compatibility="8.1.001" expanded="true" height="103" name="Filter Examples (2)" width="90" x="313" y="34">
<list key="filters_list">
<parameter key="filters_entry_key" value="Signal.eq.1"/>
</list>
</operator>
<operator activated="true" class="series:integrate_series" compatibility="7.4.000" expanded="true" height="82" name="Buy Signal Only" width="90" x="447" y="34">
<parameter key="attribute_name" value="Returns"/>
</operator>
<operator activated="true" class="rename" compatibility="8.1.001" expanded="true" height="82" name="Buy Returns" width="90" x="581" y="34">
<parameter key="old_name" value="cumulative(Returns)"/>
<parameter key="new_name" value="Buy Signals Returns"/>
<list key="rename_additional_attributes"/>
</operator>
<operator activated="true" class="rename" compatibility="8.1.001" expanded="true" height="82" name="Buy and Hold Returns" width="90" x="581" y="289">
<parameter key="old_name" value="cumulative(Returns)"/>
<parameter key="new_name" value="Buy and Hold"/>
<list key="rename_additional_attributes"/>
</operator>
<connect from_port="in 1" to_op="Multiply (3)" to_port="input"/>
<connect from_op="Multiply (3)" from_port="output 1" to_op="Filter Examples (2)" to_port="example set input"/>
<connect from_op="Multiply (3)" from_port="output 2" to_op="All Signals" to_port="example set input"/>
<connect from_op="All Signals" from_port="example set output" to_op="Buy and Hold Returns" to_port="example set input"/>
<connect from_op="Filter Examples (2)" from_port="example set output" to_op="Buy Signal Only" to_port="example set input"/>
<connect from_op="Buy Signal Only" from_port="example set output" to_op="Buy Returns" to_port="example set input"/>
<connect from_op="Buy Returns" from_port="example set output" to_port="out 1"/>
<connect from_op="Buy and Hold Returns" from_port="example set output" to_port="out 2"/>
<portSpacing port="source_in 1" spacing="0"/>
<portSpacing port="source_in 2" spacing="0"/>
<portSpacing port="sink_out 1" spacing="0"/>
<portSpacing port="sink_out 2" spacing="0"/>
<portSpacing port="sink_out 3" spacing="0"/>
<description align="center" color="yellow" colored="false" height="105" resized="false" width="180" x="337" y="147">Set the previous value to the missing value</description>
</process>
</operator>
<operator activated="false" class="subprocess" compatibility="8.1.001" expanded="true" height="103" name="Subprocess" width="90" x="581" y="289">
<process expanded="true">
<operator activated="true" class="series:windowing" compatibility="7.4.000" expanded="true" height="82" name="Window for Training" width="90" x="45" y="187">
<parameter key="window_size" value="1"/>
<parameter key="create_label" value="true"/>
<parameter key="label_attribute" value="Signal"/>
<parameter key="add_incomplete_windows" value="true"/>
</operator>
<operator activated="true" class="concurrency:optimize_parameters_grid" compatibility="8.1.001" expanded="true" height="124" name="Optimize Parameters (Grid)" width="90" x="179" y="34">
<list key="parameters">
<parameter key="Backtesting.test_window_width" value="[2;5;4;linear]"/>
<parameter key="Backtesting.training_window_step_size" value="[1;5;4;linear]"/>
<parameter key="Backtesting.training_window_width" value="[2;5;4;linear]"/>
<parameter key="SVM for HV Calc.kernel_gamma" value="[0.01;1000;5;logarithmic]"/>
<parameter key="SVM for HV Calc.C" value="[0;10000;2;linear]"/>
</list>
<process expanded="true">
<operator activated="true" class="series:sliding_window_validation" compatibility="7.4.000" expanded="true" height="124" name="Backtesting" width="90" x="179" y="34">
<parameter key="training_window_width" value="6"/>
<parameter key="test_window_width" value="6"/>
<parameter key="cumulative_training" value="true"/>
<process expanded="true">
<operator activated="true" class="support_vector_machine" compatibility="8.1.001" expanded="true" height="124" name="SVM for HV Calc" width="90" x="179" y="34">
<parameter key="kernel_type" value="radial"/>
<parameter key="kernel_gamma" value="0.10000000000000002"/>
<parameter key="C" value="200.0"/>
</operator>
<connect from_port="training" to_op="SVM for HV Calc" to_port="training set"/>
<connect from_op="SVM for HV Calc" from_port="model" to_port="model"/>
<portSpacing port="source_training" spacing="0"/>
<portSpacing port="sink_model" spacing="0"/>
<portSpacing port="sink_through 1" spacing="0"/>
</process>
<process expanded="true">
<operator activated="true" class="apply_model" compatibility="7.1.001" expanded="true" height="82" name="Apply Model In Testing" width="90" x="45" y="34">
<list key="application_parameters"/>
</operator>
<operator activated="true" class="series:forecasting_performance" compatibility="7.4.000" expanded="true" height="82" name="Forecast Performance" width="90" x="246" y="34">
<parameter key="horizon" value="1"/>
<parameter key="main_criterion" value="prediction_trend_accuracy"/>
</operator>
<connect from_port="model" to_op="Apply Model In Testing" to_port="model"/>
<connect from_port="test set" to_op="Apply Model In Testing" to_port="unlabelled data"/>
<connect from_op="Apply Model In Testing" from_port="labelled data" to_op="Forecast Performance" to_port="labelled data"/>
<connect from_op="Forecast Performance" from_port="performance" to_port="averagable 1"/>
<portSpacing port="source_model" spacing="0"/>
<portSpacing port="source_test set" spacing="0"/>
<portSpacing port="source_through 1" spacing="0"/>
<portSpacing port="sink_averagable 1" spacing="0"/>
<portSpacing port="sink_averagable 2" spacing="0"/>
</process>
</operator>
<connect from_port="input 1" to_op="Backtesting" to_port="training"/>
<connect from_op="Backtesting" from_port="model" to_port="model"/>
<connect from_op="Backtesting" from_port="averagable 1" to_port="performance"/>
<portSpacing port="source_input 1" spacing="0"/>
<portSpacing port="source_input 2" spacing="0"/>
<portSpacing port="sink_performance" spacing="0"/>
<portSpacing port="sink_model" spacing="0"/>
<portSpacing port="sink_output 1" spacing="0"/>
</process>
</operator>
<operator activated="true" class="series:windowing" compatibility="7.4.000" expanded="true" height="82" name="Window for Prediction" width="90" x="179" y="289">
<parameter key="window_size" value="1"/>
</operator>
<operator activated="true" class="apply_model" compatibility="7.1.001" expanded="true" height="82" name="Apply SVM model" width="90" x="380" y="136">
<list key="application_parameters"/>
</operator>
<connect from_port="in 1" to_op="Window for Training" to_port="example set input"/>
<connect from_op="Window for Training" from_port="example set output" to_op="Optimize Parameters (Grid)" to_port="input 1"/>
<connect from_op="Window for Training" from_port="original" to_op="Window for Prediction" to_port="example set input"/>
<connect from_op="Optimize Parameters (Grid)" from_port="performance" to_port="out 1"/>
<connect from_op="Optimize Parameters (Grid)" from_port="model" to_op="Apply SVM model" to_port="model"/>
<connect from_op="Window for Prediction" from_port="example set output" to_op="Apply SVM model" to_port="unlabelled data"/>
<connect from_op="Apply SVM model" from_port="labelled data" to_port="out 2"/>
<portSpacing port="source_in 1" spacing="0"/>
<portSpacing port="source_in 2" spacing="0"/>
<portSpacing port="sink_out 1" spacing="0"/>
<portSpacing port="sink_out 2" spacing="0"/>
<portSpacing port="sink_out 3" spacing="0"/>
</process>
</operator>
<connect from_op="Load Data" from_port="out 1" to_op="Generate Trading Signal" to_port="example set input"/>
<connect from_op="Generate Trading Signal" from_port="example set output" to_op="Select Final Col" to_port="example set input"/>
<connect from_op="Select Final Col" from_port="example set output" to_op="Multiply (2)" to_port="input"/>
<connect from_op="Multiply (2)" from_port="output 1" to_op="Cum Sum of Returns" to_port="in 1"/>
<connect from_op="Cum Sum of Returns" from_port="out 1" to_port="result 1"/>
<connect from_op="Cum Sum of Returns" from_port="out 2" to_port="result 2"/>
<portSpacing port="source_input 1" spacing="0"/>
<portSpacing port="sink_result 1" spacing="0"/>
<portSpacing port="sink_result 2" spacing="0"/>
<portSpacing port="sink_result 3" spacing="0"/>
<description align="center" color="yellow" colored="false" height="120" resized="false" width="180" x="31" y="195">Position Sizing?<br>Need to add: <br>Volatility based position sizing<br>buy and sell = $7, no slippage</description>
</process>
</operator>
</process>
PS: to test this, just go to Yahoo Finance and download historical quote data for a stock and then repath it in the Read CSV operator. Use at least a 2 year time period.
Next Steps
I still have several ‘kink’s to work out but I can definitely see the opportunity for optimization here, such as:
- Why use a rolling 90 day window? Use parameter optimization to vary that value from 50 to 100.
- Why use a 20 day moving average? You could vary between a 10 or 30 day MA?
- Write a python script to download EOD stock data and then have RapidMiner loop through it.
- Write an commission and slippage subprocess to see if this method IS really profitable or not.
- Offload the processes to a RapidMiner Server and have it spit out trading recommendations on a daily basis
Predicting Historical Volatility with RapidMiner
Predicting Historical Volatility is easy with RapidMiner. The attached process uses RapidMiner to recreate a research paper Options trading driven by volatility directional accuracy on how to predict historical volatility (HV) for the S&P500. The idea was to predict the HV 5 trading days ahead from Friday to Friday and then compare it with the Implied Volatility (IV) of the S&P500. If the directions of HV and IV converge or diverge, then you would execute a specific type of option trade.
I did take some liberties with the research paper. At first I did use a Neural Net algorithm to train the data and I got a greater than 50% directional accuracy. When I switched to a SVM with and RBF kernel, I got it over 60%. Then when I added optimization for the Training and Testing Windows, gamma, and C parameters, I managed to get this over 70%.
I did test this “live” by paper trading it and managed to be right 7 out of 10 times. I did not execute any actually trades.
<?xml version="1.0" encoding="UTF-8"?><process version="7.6.003">
<context>
<input/>
<output/>
<macros/>
</context>
<operator activated="true" class="process" compatibility="7.6.003" expanded="true" name="Process">
<process expanded="true">
<operator activated="true" class="subprocess" compatibility="7.6.003" expanded="true" height="82" name="Load S&P500 Data for HV calc" width="90" x="45" y="34">
<process expanded="true">
<operator activated="true" class="read_csv" compatibility="7.6.003" expanded="true" height="68" name="Read Downloaded S&P500" width="90" x="45" y="34">
<parameter key="csv_file" value="C:\Users\Thomas Ott\Downloads\^GSPC.csv"/>
<parameter key="column_separators" value=","/>
<parameter key="first_row_as_names" value="false"/>
<list key="annotations">
<parameter key="0" value="Name"/>
</list>
<list key="data_set_meta_data_information">
<parameter key="0" value="Date.true.polynominal.attribute"/>
<parameter key="1" value="Open.true.real.attribute"/>
<parameter key="2" value="High.true.real.attribute"/>
<parameter key="3" value="Low.true.real.attribute"/>
<parameter key="4" value="Close.true.real.attribute"/>
<parameter key="5" value="Adj Close.true.real.attribute"/>
<parameter key="6" value="Volume.true.real.attribute"/>
</list>
<description align="center" color="transparent" colored="false" width="126">Due to Yahoo changes, must download CSV file manually for now!</description>
</operator>
<operator activated="true" class="series:lag_series" compatibility="7.4.000" expanded="true" height="82" name="Lag Series" width="90" x="179" y="34">
<list key="attributes">
<parameter key="Close" value="1"/>
</list>
<description align="center" color="transparent" colored="false" width="126">Lag Series for LN calculation</description>
</operator>
<operator activated="true" class="generate_attributes" compatibility="7.6.003" expanded="true" height="82" name="Calc Natural Log" width="90" x="313" y="34">
<list key="function_descriptions">
<parameter key="Log Returns" value="ln(Close/[Close-1])"/>
</list>
</operator>
<operator activated="true" class="select_attributes" compatibility="7.6.003" expanded="true" height="82" name="Select Attributes for ETL" width="90" x="447" y="34">
<parameter key="attribute_filter_type" value="single"/>
<parameter key="attribute" value="^GSPC_CLOSE-1"/>
<parameter key="invert_selection" value="true"/>
</operator>
<operator activated="true" class="replace_missing_values" compatibility="7.6.003" expanded="true" height="103" name="Replace Missing Values" width="90" x="581" y="34">
<parameter key="attribute_filter_type" value="value_type"/>
<parameter key="value_type" value="numeric"/>
<parameter key="default" value="zero"/>
<list key="columns"/>
</operator>
<connect from_op="Read Downloaded S&P500" from_port="output" to_op="Lag Series" to_port="example set input"/>
<connect from_op="Lag Series" from_port="example set output" to_op="Calc Natural Log" to_port="example set input"/>
<connect from_op="Calc Natural Log" from_port="example set output" to_op="Select Attributes for ETL" to_port="example set input"/>
<connect from_op="Select Attributes for ETL" from_port="example set output" to_op="Replace Missing Values" to_port="example set input"/>
<connect from_op="Replace Missing Values" from_port="example set output" to_port="out 1"/>
<portSpacing port="source_in 1" spacing="0"/>
<portSpacing port="sink_out 1" spacing="0"/>
<portSpacing port="sink_out 2" spacing="0"/>
</process>
<description align="center" color="transparent" colored="false" width="126">Load CSV data</description>
</operator>
<operator activated="true" class="subprocess" compatibility="7.6.003" expanded="true" height="82" name="Prep Data for X-Val" width="90" x="179" y="34">
<process expanded="true">
<operator activated="true" class="series:windowing" compatibility="7.4.000" expanded="true" height="82" name="Windowing" width="90" x="45" y="34">
<parameter key="window_size" value="5"/>
<parameter key="label_attribute" value="^GSPC_CLOSE"/>
</operator>
<operator activated="true" class="generate_aggregation" compatibility="7.6.003" expanded="true" height="82" name="Generate Aggregation" width="90" x="179" y="34">
<parameter key="attribute_name" value="StDev"/>
<parameter key="attribute_filter_type" value="subset"/>
<parameter key="attributes" value="Log Returns-0|Log Returns-1|Log Returns-2|Log Returns-3|Log Returns-4"/>
<parameter key="aggregation_function" value="standard_deviation"/>
</operator>
<operator activated="true" class="multiply" compatibility="7.6.003" expanded="true" height="103" name="Multiply" width="90" x="313" y="34"/>
<operator activated="true" class="select_attributes" compatibility="7.6.003" expanded="true" height="82" name="Select StDev and Date" width="90" x="514" y="187">
<parameter key="attribute_filter_type" value="subset"/>
<parameter key="attributes" value="Date-0|StDev"/>
</operator>
<operator activated="true" class="select_attributes" compatibility="7.6.003" expanded="true" height="82" name="Select Close and LN" width="90" x="514" y="34">
<parameter key="attribute_filter_type" value="subset"/>
<parameter key="attributes" value="Date-0|Date-9|Log Returns-9|^GSPC_CLOSE-0|^GSPC_CLOSE-9|Close-0"/>
</operator>
<operator activated="true" class="generate_attributes" compatibility="7.6.003" expanded="true" height="82" name="Generate HV dummy for manipulation" width="90" x="648" y="187">
<list key="function_descriptions">
<parameter key="HVdummy" value="StDev*sqrt(252)"/>
</list>
</operator>
<operator activated="true" class="join" compatibility="7.6.003" expanded="true" height="82" name="Join" width="90" x="715" y="34">
<parameter key="join_type" value="outer"/>
<parameter key="use_id_attribute_as_key" value="false"/>
<list key="key_attributes">
<parameter key="Date-0" value="Date-0"/>
</list>
</operator>
<operator activated="true" class="rename" compatibility="7.6.003" expanded="true" height="82" name="Rename" width="90" x="782" y="136">
<parameter key="old_name" value="HVdummy"/>
<parameter key="new_name" value="HV 5day Daily"/>
<list key="rename_additional_attributes">
<parameter key="Close-0" value="S&P500_Close"/>
<parameter key="Date-0" value="Date"/>
</list>
</operator>
<operator activated="true" class="select_attributes" compatibility="7.6.003" expanded="true" height="82" name="Select Final Attributes" width="90" x="916" y="136">
<parameter key="attribute_filter_type" value="subset"/>
<parameter key="attributes" value="Date|S&P500_Close|HV 10day Daily|HV 5day Daily"/>
</operator>
<operator activated="true" class="nominal_to_date" compatibility="7.6.003" expanded="true" height="82" name="Nominal to Date" width="90" x="1050" y="136">
<parameter key="attribute_name" value="Date"/>
<parameter key="date_format" value="yyyy-MM-dd"/>
</operator>
<operator activated="true" class="date_to_numerical" compatibility="7.6.003" expanded="true" height="82" name="Date to Numerical" width="90" x="1184" y="136">
<parameter key="attribute_name" value="Date"/>
<parameter key="time_unit" value="day"/>
<parameter key="day_relative_to" value="week"/>
<parameter key="keep_old_attribute" value="true"/>
</operator>
<operator activated="true" class="filter_examples" compatibility="7.6.003" expanded="true" height="103" name="Filter Examples" width="90" x="1318" y="136">
<list key="filters_list">
<parameter key="filters_entry_key" value="Date_day.eq.6"/>
</list>
</operator>
<operator activated="true" class="select_attributes" compatibility="7.6.003" expanded="true" height="82" name="Toss out Date_day" width="90" x="1452" y="136">
<parameter key="attribute_filter_type" value="single"/>
<parameter key="attribute" value="Date_day"/>
<parameter key="invert_selection" value="true"/>
</operator>
<operator activated="true" class="series:lag_series" compatibility="7.4.000" expanded="true" height="82" name="Lag HV" width="90" x="1586" y="136">
<list key="attributes">
<parameter key="HV 5day Daily" value="1"/>
</list>
</operator>
<operator activated="true" class="series:moving_average" compatibility="7.4.000" expanded="true" height="82" name="Moving Average" width="90" x="1720" y="136">
<parameter key="attribute_name" value="HV 5day Daily"/>
<parameter key="window_width" value="13"/>
</operator>
<operator activated="true" class="replace_missing_values" compatibility="7.6.003" expanded="true" height="103" name="Replace Missing Values (2)" width="90" x="1854" y="136">
<parameter key="attribute_filter_type" value="subset"/>
<parameter key="attributes" value="average(HV 5day Daily)|HV 5day Daily-1"/>
<parameter key="default" value="zero"/>
<list key="columns"/>
</operator>
<operator activated="true" class="rename" compatibility="7.6.003" expanded="true" height="82" name="Rename Attributes Humanely" width="90" x="1988" y="136">
<parameter key="old_name" value="average(HV 5day Daily)"/>
<parameter key="new_name" value="HV MA13"/>
<list key="rename_additional_attributes">
<parameter key="HV 5day Daily-1" value="Naive HV"/>
</list>
</operator>
<connect from_port="in 1" to_op="Windowing" to_port="example set input"/>
<connect from_op="Windowing" from_port="example set output" to_op="Generate Aggregation" to_port="example set input"/>
<connect from_op="Generate Aggregation" from_port="example set output" to_op="Multiply" to_port="input"/>
<connect from_op="Multiply" from_port="output 1" to_op="Select Close and LN" to_port="example set input"/>
<connect from_op="Multiply" from_port="output 2" to_op="Select StDev and Date" to_port="example set input"/>
<connect from_op="Select StDev and Date" from_port="example set output" to_op="Generate HV dummy for manipulation" to_port="example set input"/>
<connect from_op="Select Close and LN" from_port="example set output" to_op="Join" to_port="left"/>
<connect from_op="Generate HV dummy for manipulation" from_port="example set output" to_op="Join" to_port="right"/>
<connect from_op="Join" from_port="join" to_op="Rename" to_port="example set input"/>
<connect from_op="Rename" from_port="example set output" to_op="Select Final Attributes" to_port="example set input"/>
<connect from_op="Select Final Attributes" from_port="example set output" to_op="Nominal to Date" to_port="example set input"/>
<connect from_op="Nominal to Date" from_port="example set output" to_op="Date to Numerical" to_port="example set input"/>
<connect from_op="Date to Numerical" from_port="example set output" to_op="Filter Examples" to_port="example set input"/>
<connect from_op="Filter Examples" from_port="example set output" to_op="Toss out Date_day" to_port="example set input"/>
<connect from_op="Toss out Date_day" from_port="example set output" to_op="Lag HV" to_port="example set input"/>
<connect from_op="Lag HV" from_port="example set output" to_op="Moving Average" to_port="example set input"/>
<connect from_op="Moving Average" from_port="example set output" to_op="Replace Missing Values (2)" to_port="example set input"/>
<connect from_op="Replace Missing Values (2)" from_port="example set output" to_op="Rename Attributes Humanely" to_port="example set input"/>
<connect from_op="Rename Attributes Humanely" from_port="example set output" to_port="out 1"/>
<portSpacing port="source_in 1" spacing="0"/>
<portSpacing port="source_in 2" spacing="0"/>
<portSpacing port="sink_out 1" spacing="0"/>
<portSpacing port="sink_out 2" spacing="0"/>
</process>
<description align="center" color="transparent" colored="false" width="126">Data Prep</description>
</operator>
<operator activated="true" class="series:windowing" compatibility="7.4.000" expanded="true" height="82" name="Window for Training" width="90" x="313" y="187">
<parameter key="window_size" value="1"/>
<parameter key="create_label" value="true"/>
<parameter key="label_attribute" value="HV 5day Daily"/>
<parameter key="add_incomplete_windows" value="true"/>
</operator>
<operator activated="true" class="optimize_parameters_grid" compatibility="7.6.003" expanded="true" height="124" name="Optimize Parameters (Grid)" width="90" x="447" y="34">
<list key="parameters">
<parameter key="Backtesting.training_window_width" value="[6;12;4;linear]"/>
<parameter key="Backtesting.test_window_width" value="[6;12;4;linear]"/>
<parameter key="SVM for HV Calc.kernel_gamma" value="[.01;1000;5;logarithmic]"/>
<parameter key="SVM for HV Calc.C" value="[0;1000;5;linear]"/>
</list>
<process expanded="true">
<operator activated="true" class="series:sliding_window_validation" compatibility="7.4.000" expanded="true" height="124" name="Backtesting" width="90" x="179" y="34">
<parameter key="training_window_width" value="6"/>
<parameter key="test_window_width" value="6"/>
<parameter key="cumulative_training" value="true"/>
<process expanded="true">
<operator activated="true" class="support_vector_machine" compatibility="7.6.003" expanded="true" height="124" name="SVM for HV Calc" width="90" x="179" y="34">
<parameter key="kernel_type" value="radial"/>
<parameter key="kernel_gamma" value="0.10000000000000002"/>
<parameter key="C" value="200.0"/>
</operator>
<connect from_port="training" to_op="SVM for HV Calc" to_port="training set"/>
<connect from_op="SVM for HV Calc" from_port="model" to_port="model"/>
<portSpacing port="source_training" spacing="0"/>
<portSpacing port="sink_model" spacing="0"/>
<portSpacing port="sink_through 1" spacing="0"/>
</process>
<process expanded="true">
<operator activated="true" class="apply_model" compatibility="7.1.001" expanded="true" height="82" name="Apply Model In Testing" width="90" x="45" y="34">
<list key="application_parameters"/>
</operator>
<operator activated="true" class="series:forecasting_performance" compatibility="7.4.000" expanded="true" height="82" name="Forecast Performance" width="90" x="246" y="34">
<parameter key="horizon" value="1"/>
<parameter key="main_criterion" value="prediction_trend_accuracy"/>
</operator>
<connect from_port="model" to_op="Apply Model In Testing" to_port="model"/>
<connect from_port="test set" to_op="Apply Model In Testing" to_port="unlabelled data"/>
<connect from_op="Apply Model In Testing" from_port="labelled data" to_op="Forecast Performance" to_port="labelled data"/>
<connect from_op="Forecast Performance" from_port="performance" to_port="averagable 1"/>
<portSpacing port="source_model" spacing="0"/>
<portSpacing port="source_test set" spacing="0"/>
<portSpacing port="source_through 1" spacing="0"/>
<portSpacing port="sink_averagable 1" spacing="0"/>
<portSpacing port="sink_averagable 2" spacing="0"/>
</process>
</operator>
<operator activated="true" class="log" compatibility="7.6.003" expanded="true" height="82" name="Log" width="90" x="313" y="85">
<parameter key="filename" value="tmp"/>
<list key="log">
<parameter key="Gamma" value="operator.SVM for HV Calc.parameter.kernel_gamma"/>
<parameter key="C" value="operator.SVM for HV Calc.parameter.C"/>
<parameter key="Training Width" value="operator.Backtesting.parameter.training_window_width"/>
<parameter key="Testing Width" value="operator.Backtesting.parameter.test_window_width"/>
<parameter key="Forecast Perf" value="operator.Backtesting.value.performance"/>
<parameter key="Culm Training" value="operator.Backtesting.parameter.cumulative_training"/>
</list>
</operator>
<connect from_port="input 1" to_op="Backtesting" to_port="training"/>
<connect from_op="Backtesting" from_port="model" to_port="result 1"/>
<connect from_op="Backtesting" from_port="averagable 1" to_op="Log" to_port="through 1"/>
<connect from_op="Log" from_port="through 1" to_port="performance"/>
<portSpacing port="source_input 1" spacing="0"/>
<portSpacing port="source_input 2" spacing="0"/>
<portSpacing port="sink_performance" spacing="0"/>
<portSpacing port="sink_result 1" spacing="0"/>
<portSpacing port="sink_result 2" spacing="0"/>
</process>
</operator>
<operator activated="true" class="series:windowing" compatibility="7.4.000" expanded="true" height="82" name="Window for Prediction" width="90" x="447" y="289">
<parameter key="window_size" value="1"/>
</operator>
<operator activated="true" class="apply_model" compatibility="7.1.001" expanded="true" height="82" name="Apply SVM model" width="90" x="648" y="136">
<list key="application_parameters"/>
</operator>
<operator activated="true" class="generate_attributes" compatibility="7.6.003" expanded="true" height="82" name="Generate Attributes" width="90" x="782" y="136">
<list key="function_descriptions">
<parameter key="Absolute Error" value="([prediction(label)]-[HV 5day Daily-0])/[HV 5day Daily-0]"/>
</list>
</operator>
<connect from_op="Load S&P500 Data for HV calc" from_port="out 1" to_op="Prep Data for X-Val" to_port="in 1"/>
<connect from_op="Prep Data for X-Val" from_port="out 1" to_op="Window for Training" to_port="example set input"/>
<connect from_op="Window for Training" from_port="example set output" to_op="Optimize Parameters (Grid)" to_port="input 1"/>
<connect from_op="Window for Training" from_port="original" to_op="Window for Prediction" to_port="example set input"/>
<connect from_op="Optimize Parameters (Grid)" from_port="performance" to_port="result 1"/>
<connect from_op="Optimize Parameters (Grid)" from_port="parameter" to_port="result 2"/>
<connect from_op="Optimize Parameters (Grid)" from_port="result 1" to_op="Apply SVM model" to_port="model"/>
<connect from_op="Window for Prediction" from_port="example set output" to_op="Apply SVM model" to_port="unlabelled data"/>
<connect from_op="Apply SVM model" from_port="labelled data" to_op="Generate Attributes" to_port="example set input"/>
<connect from_op="Generate Attributes" from_port="example set output" to_port="result 3"/>
<portSpacing port="source_input 1" spacing="0"/>
<portSpacing port="sink_result 1" spacing="0"/>
<portSpacing port="sink_result 2" spacing="0"/>
<portSpacing port="sink_result 3" spacing="0"/>
<portSpacing port="sink_result 4" spacing="0"/>
</process>
</operator>
</process>
The data file is here: ^GSPC
Instagram API and working with JSON path in RapidMiner
I used Scott’s excellent RapidMiner Instagram API tutorial to build one of my clients a simple hashtag/keyword tool for brand marketing. The problem with that process was that it used the Instgram API and needed access tokens. First, getting an access token from Instagram was an utter pain in the butt and second, the Instgram API is being deprecated.
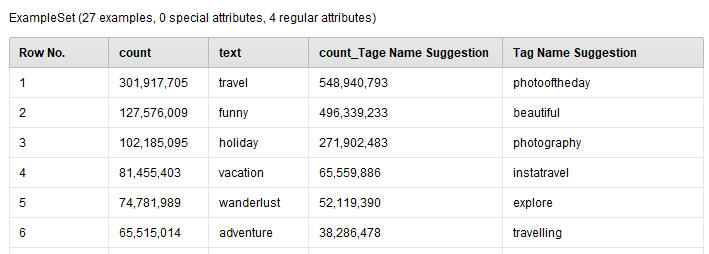
Fast forward 6 months and my neice in South Africa has started a TravelBlog site. She mostly posts her videos and photos to Instagram and was very interested in using the hashtag tool I built. So I made some changes for her and put in production. A few times a week she uploads a spreadsheet to a shared folder and consumes the results via a spreadsheet in an output folder.
How does it work?
It’s simple in the way it works, I have a RapidMiner Server watching the upload folder and when it sees a new spreadsheet, it triggers the the process to extract hashtag metadata. In about 25 seconds, a new spreadsheet is written back to an output folder with how popular the tags she chose are.
GREAT!
The next version of the tool was to incorporate keyword suggestions from the tags she uploaded. So I started working on an updated process incorporating Hypernyms and Hyponyms from RapidMiner’s Wordnet Extension. I built the entire process and started testing it. Then POOF! DISASTER!
I rate blocked myself or the API just broke. Not sure which, but I’m leaning toward the former. Now what?
The solution
The solution came from extracting the JSON information associated with each hashtag by accessing the following URL: https://www.instagram.com/explore/tags/{HASHTAG}/?a=1 I had to use some of the built-in RapidMiner functionality for working with JSONPath and I ended up learning some new tricks.
The JSONPath online evaluator really helped me here. With a bit of tweaking the original hashtag tool was back in production and the day was saved. However, this got me to thinking about how I could be a better Internet citizen when it comes to extracting data from the Instagrams of the world. I think the solution would be to download the actual JSON file and maybe store it into database. From there I could use a simple JSONPath to extract the hashtag count and store the results in another table.
I could even log a timestamp and with some cron scheduling, build up a comprehensive database for the growth and/or decline of hashtags.
The majority of these processes are just ETL and there is very little machine learning. However, with the new LDA operators and in combination with the excellent Text Processing RapidMiner has, I think I could come up with a better hashtag suggestion tool.
Autolabeling a Training Set with One Class SVMs in RapidMiner
I’ve been struggling with how to separate the signal from noise in Twitter data. There’s great content and sentiment there but it’s buried by nonsense tweets and noise. How do you find that true signal within the noise?
This question wracked my brain until I solved it with a one-class SVM application in RapidMiner.
If you read and use my RapidMiner Twitter Content process from here, you would’ve noted that process didn’t include any labels. The labels were something left “to do” at the end of the tutorial and I spent a few days thinking on how to go about it. My first method was to label tweets based on Retweets and the second method was to label tweets based on Binning. Both of these methods are easy but they didn’t solve the problem at hand.
Labeling based on Retweets
With this method I created a label class of “Important” and “Not Important” based on the number of retweets a post had. This was the simplest way to cut the traning set into two classes but I had to choose an arbitrary Retweet value. What was the right number of Retweets? If you look at the tweets surrounding #machinelearning, #ai, and #datascience you’ll notice that a large amount retweets happen from a small handful of ‘Twitterati’. Not to pick on @KirkDBorne but when he Tweets something, bots and people Retweet it like crazy.
There’s a large percentage of the tweets he sends that links back to content that’s been posted or generated elsewhere. He happens to have a large following that Retweets his stuff like crazy. His Retweets can range in the 100’s, so does this mean those Tweets are ‘Important’ or a lot of noise? If some Tweet only has 10 Retweets but it’s a great link, does that mean it’s “Not Important?
So what’s the right number of retweets? One? Ten? One Hundred? There was no good answer here because I didn’t know what the right number was.
Labeling based on Binning
My next thought was to bin the tweets based on their Retweets into two buckets. Bucket one would be “Not Important” and bucket two would be “Important.” When I did this, I started getting a distribution that look better. It wasn’t till I examined the buckets that I realized that this method gleaned over a lot of good tweets.
In essence I was repeating the same mistakes as labeling based on Retweets. So if I trained a model on this, I’d still get shit.
Labeling based on a One Class SVM
I realized after trying the above two methods that there was no easy to do it. I wanted to find a lazy way of autolabeling but soon came back what is important, the training set.
The power and accuracy of any classification model depends on how good its training set is. Never overlook this!
The solution was to use a One Class SVM process in RapidMiner. I would get a set of 100 to 200 Tweets, read through them, and then ONLY label the ‘Important’ ones. What were the ‘Important’ ones? Any Tweet that I thought was interesting to me and my followers.
After I marked the Important Tweets, I imported that data set into RapidMiner and built my process. The process is simple.

The top process branch loads the hand labeled data, does some Text Processing on it, and feeds it into a SVM set with a One-Class kernel. Now the following is important!
The use a One Class SVM in RapidMiner, you have to train it only on one class, ‘Important’ being that class. When you apply the model to out of sample (OOS) data, it will generate an ‘inside’ and ‘outside’ prediction with confidence values. These values show how close the new data point is inside the ‘Important’ class (meaning it’s Important) or outside of that class. I end up renaming the ‘inside’ and ‘outside’ predictions to ‘Important’ and ‘Not Important’ .
The bottom process takes the OOS data, text processes it, and applys the model for prediction. At the end I do some cleanup where I merge the Tweets together so I can feed it into my Twitter Content model and find my Important words and actually build a classification model now!
Within a few seconds, I had an autolabeled data set! YAH!
Caution
While this process is a GREAT first start, there is more work to do. For example, I selected an RBF kernel and a gammas of 0.001 as a starting point. This was a guess and I need to put together and optimization process to help me figure out that right parameters to use to get a better autolabeling model. I’m also interested in using @mschmitz_’s LIME operator to help me understand the potential outliers when using this autolabeling method.
The Process
As I noted above, this process is a ‘work in proces’ so use with caution. It’s a great blueprint because applying One Class SVM’s in RapidMiner is easy but sometimes confusing.
<?xml version="1.0" encoding="UTF-8"?><process version="7.6.001">
<context>
<input/>
<output/>
<macros/>
</context>
<operator activated="true" class="process" compatibility="7.6.001" expanded="true" name="Process">
<process expanded="true">
<operator activated="true" class="open_file" compatibility="7.6.001" expanded="true" height="68" name="Open File" width="90" x="45" y="136">
<parameter key="resource_type" value="URL"/>
<parameter key="url" value="https://www.neuralmarkettrends.com/_public/2017/tempfile.xlsx"/>
</operator>
<operator activated="true" class="read_excel" compatibility="7.6.001" expanded="true" height="68" name="Read Excel" width="90" x="45" y="34">
<list key="annotations"/>
<list key="data_set_meta_data_information"/>
</operator>
<operator activated="true" class="social_media:search_twitter" compatibility="7.3.000" expanded="true" height="68" name="Search Twitter" width="90" x="45" y="238">
<parameter key="connection" value="Twitter - Studio Connection"/>
<parameter key="query" value="machinelearning && ai && datascience"/>
<parameter key="result_type" value="recent"/>
<parameter key="limit" value="3000"/>
<parameter key="language" value="en"/>
</operator>
<operator activated="true" class="select_attributes" compatibility="7.6.001" expanded="true" height="82" name="Select label and text 2" width="90" x="179" y="238">
<parameter key="attribute_filter_type" value="subset"/>
<parameter key="attributes" value="Text|label|Retweet-Count"/>
</operator>
<operator activated="true" class="multiply" compatibility="7.6.001" expanded="true" height="103" name="Multiply" width="90" x="313" y="289"/>
<operator activated="true" class="nominal_to_text" compatibility="7.6.001" expanded="true" height="82" name="Nominal to Text 2" width="90" x="447" y="187">
<parameter key="attribute_filter_type" value="single"/>
<parameter key="attribute" value="Text"/>
</operator>
<operator activated="true" class="filter_examples" compatibility="7.6.001" expanded="true" height="103" name="Filter missing labels" width="90" x="179" y="34">
<list key="filters_list">
<parameter key="filters_entry_key" value="label.is_not_missing."/>
</list>
</operator>
<operator activated="true" class="select_attributes" compatibility="7.6.001" expanded="true" height="82" name="Select label and text" width="90" x="313" y="34">
<parameter key="attribute_filter_type" value="subset"/>
<parameter key="attributes" value="Text|label|Retweet-Count"/>
</operator>
<operator activated="true" class="nominal_to_text" compatibility="7.6.001" expanded="true" height="82" name="Nominal to Text" width="90" x="447" y="34">
<parameter key="attribute_filter_type" value="single"/>
<parameter key="attribute" value="Text"/>
</operator>
<operator activated="true" class="set_role" compatibility="7.6.001" expanded="true" height="82" name="Set Label" width="90" x="581" y="34">
<parameter key="attribute_name" value="label"/>
<parameter key="target_role" value="label"/>
<list key="set_additional_roles"/>
</operator>
<operator activated="true" class="text:process_document_from_data" compatibility="7.5.000" expanded="true" height="82" name="Process Documents from Data" width="90" x="715" y="34">
<parameter key="prune_method" value="percentual"/>
<parameter key="prune_below_percent" value="5.0"/>
<parameter key="prune_above_percent" value="50.0"/>
<parameter key="prune_below_absolute" value="100"/>
<parameter key="prune_above_absolute" value="500"/>
<parameter key="select_attributes_and_weights" value="true"/>
<list key="specify_weights">
<parameter key="Text" value="2.0"/>
</list>
<process expanded="true">
<operator activated="true" class="text:replace_tokens" compatibility="7.5.000" expanded="true" height="68" name="Replace Tokens (2)" width="90" x="45" y="34">
<list key="replace_dictionary">
<parameter key="http.*" value="link"/>
</list>
</operator>
<operator activated="true" class="text:tokenize" compatibility="7.5.000" expanded="true" height="68" name="Tokenize" width="90" x="179" y="34">
<parameter key="mode" value="specify characters"/>
<parameter key="characters" value=" .!;:[,"/>
</operator>
<operator activated="true" class="text:transform_cases" compatibility="7.5.000" expanded="true" height="68" name="Transform Cases" width="90" x="313" y="34"/>
<operator activated="true" class="text:filter_by_length" compatibility="7.5.000" expanded="true" height="68" name="Filter Tokens (by Length)" width="90" x="447" y="34"/>
<operator activated="true" class="text:generate_n_grams_terms" compatibility="7.5.000" expanded="true" height="68" name="Generate n-Grams (Terms)" width="90" x="581" y="34"/>
<operator activated="true" class="text:filter_tokens_by_content" compatibility="7.5.000" expanded="true" height="68" name="Filter Tokens (by Content)" width="90" x="715" y="34">
<parameter key="string" value="link"/>
<parameter key="invert condition" value="true"/>
</operator>
<operator activated="true" class="text:filter_stopwords_english" compatibility="7.5.000" expanded="true" height="68" name="Filter Stopwords (English)" width="90" x="849" y="34"/>
<connect from_port="document" to_op="Replace Tokens (2)" to_port="document"/>
<connect from_op="Replace Tokens (2)" from_port="document" to_op="Tokenize" to_port="document"/>
<connect from_op="Tokenize" from_port="document" to_op="Transform Cases" to_port="document"/>
<connect from_op="Transform Cases" from_port="document" to_op="Filter Tokens (by Length)" to_port="document"/>
<connect from_op="Filter Tokens (by Length)" from_port="document" to_op="Generate n-Grams (Terms)" to_port="document"/>
<connect from_op="Generate n-Grams (Terms)" from_port="document" to_op="Filter Tokens (by Content)" to_port="document"/>
<connect from_op="Filter Tokens (by Content)" from_port="document" to_op="Filter Stopwords (English)" to_port="document"/>
<connect from_op="Filter Stopwords (English)" from_port="document" to_port="document 1"/>
<portSpacing port="source_document" spacing="0"/>
<portSpacing port="sink_document 1" spacing="0"/>
<portSpacing port="sink_document 2" spacing="0"/>
</process>
</operator>
<operator activated="true" class="filter_examples" compatibility="7.6.001" expanded="true" height="103" name="Filter Missing Att" width="90" x="849" y="34">
<parameter key="condition_class" value="no_missing_attributes"/>
<list key="filters_list"/>
</operator>
<operator activated="true" class="support_vector_machine_libsvm" compatibility="7.6.001" expanded="true" height="82" name="SVM" width="90" x="983" y="34">
<parameter key="svm_type" value="one-class"/>
<parameter key="gamma" value="0.001"/>
<list key="class_weights"/>
</operator>
<operator activated="true" class="text:process_document_from_data" compatibility="7.5.000" expanded="true" height="82" name="Process Documents from Data (2)" width="90" x="715" y="187">
<parameter key="prune_method" value="percentual"/>
<parameter key="prune_below_percent" value="5.0"/>
<parameter key="prune_above_percent" value="50.0"/>
<parameter key="prune_below_absolute" value="100"/>
<parameter key="prune_above_absolute" value="500"/>
<parameter key="select_attributes_and_weights" value="true"/>
<list key="specify_weights">
<parameter key="Text" value="2.0"/>
</list>
<process expanded="true">
<operator activated="true" class="text:replace_tokens" compatibility="7.5.000" expanded="true" height="68" name="Replace Tokens (3)" width="90" x="45" y="34">
<list key="replace_dictionary">
<parameter key="http.*" value="link"/>
</list>
</operator>
<operator activated="true" class="text:tokenize" compatibility="7.5.000" expanded="true" height="68" name="Tokenize (2)" width="90" x="179" y="34">
<parameter key="mode" value="specify characters"/>
<parameter key="characters" value=" .!;:[,"/>
</operator>
<operator activated="true" class="text:transform_cases" compatibility="7.5.000" expanded="true" height="68" name="Transform Cases (2)" width="90" x="313" y="34"/>
<operator activated="true" class="text:filter_by_length" compatibility="7.5.000" expanded="true" height="68" name="Filter Tokens (2)" width="90" x="447" y="34"/>
<operator activated="true" class="text:generate_n_grams_terms" compatibility="7.5.000" expanded="true" height="68" name="Generate n-Grams (2)" width="90" x="581" y="34"/>
<operator activated="true" class="text:filter_tokens_by_content" compatibility="7.5.000" expanded="true" height="68" name="Filter Tokens (3)" width="90" x="715" y="34">
<parameter key="string" value="link"/>
<parameter key="invert condition" value="true"/>
</operator>
<operator activated="true" class="text:filter_stopwords_english" compatibility="7.5.000" expanded="true" height="68" name="Filter Stopwords (2)" width="90" x="849" y="34"/>
<connect from_port="document" to_op="Replace Tokens (3)" to_port="document"/>
<connect from_op="Replace Tokens (3)" from_port="document" to_op="Tokenize (2)" to_port="document"/>
<connect from_op="Tokenize (2)" from_port="document" to_op="Transform Cases (2)" to_port="document"/>
<connect from_op="Transform Cases (2)" from_port="document" to_op="Filter Tokens (2)" to_port="document"/>
<connect from_op="Filter Tokens (2)" from_port="document" to_op="Generate n-Grams (2)" to_port="document"/>
<connect from_op="Generate n-Grams (2)" from_port="document" to_op="Filter Tokens (3)" to_port="document"/>
<connect from_op="Filter Tokens (3)" from_port="document" to_op="Filter Stopwords (2)" to_port="document"/>
<connect from_op="Filter Stopwords (2)" from_port="document" to_port="document 1"/>
<portSpacing port="source_document" spacing="0"/>
<portSpacing port="sink_document 1" spacing="0"/>
<portSpacing port="sink_document 2" spacing="0"/>
</process>
</operator>
<operator activated="true" class="filter_examples" compatibility="7.6.001" expanded="true" height="103" name="Filter Missing att 2" width="90" x="849" y="187">
<parameter key="condition_class" value="no_missing_attributes"/>
<list key="filters_list"/>
</operator>
<operator activated="true" class="apply_model" compatibility="7.6.001" expanded="true" height="82" name="Apply Model" width="90" x="1117" y="34">
<list key="application_parameters"/>
</operator>
<operator activated="true" class="join" compatibility="7.6.001" expanded="true" height="82" name="Join" width="90" x="1184" y="289">
<list key="key_attributes"/>
</operator>
<operator activated="true" class="select_attributes" compatibility="7.6.001" expanded="true" height="82" name="Select Final Set" width="90" x="1318" y="289">
<parameter key="attribute_filter_type" value="subset"/>
<parameter key="attributes" value="prediction(label)|Text|Retweet-Count"/>
</operator>
<operator activated="true" class="store" compatibility="7.6.001" expanded="true" height="68" name="Store" width="90" x="1452" y="289">
<parameter key="repository_entry" value="../data/Twitter Content Enriched Data Set"/>
</operator>
<connect from_op="Open File" from_port="file" to_op="Read Excel" to_port="file"/>
<connect from_op="Read Excel" from_port="output" to_op="Filter missing labels" to_port="example set input"/>
<connect from_op="Search Twitter" from_port="output" to_op="Select label and text 2" to_port="example set input"/>
<connect from_op="Select label and text 2" from_port="example set output" to_op="Multiply" to_port="input"/>
<connect from_op="Multiply" from_port="output 1" to_op="Nominal to Text 2" to_port="example set input"/>
<connect from_op="Multiply" from_port="output 2" to_op="Join" to_port="right"/>
<connect from_op="Nominal to Text 2" from_port="example set output" to_op="Process Documents from Data (2)" to_port="example set"/>
<connect from_op="Filter missing labels" from_port="example set output" to_op="Select label and text" to_port="example set input"/>
<connect from_op="Select label and text" from_port="example set output" to_op="Nominal to Text" to_port="example set input"/>
<connect from_op="Nominal to Text" from_port="example set output" to_op="Set Label" to_port="example set input"/>
<connect from_op="Set Label" from_port="example set output" to_op="Process Documents from Data" to_port="example set"/>
<connect from_op="Process Documents from Data" from_port="example set" to_op="Filter Missing Att" to_port="example set input"/>
<connect from_op="Process Documents from Data" from_port="word list" to_op="Process Documents from Data (2)" to_port="word list"/>
<connect from_op="Filter Missing Att" from_port="example set output" to_op="SVM" to_port="training set"/>
<connect from_op="SVM" from_port="model" to_op="Apply Model" to_port="model"/>
<connect from_op="Process Documents from Data (2)" from_port="example set" to_op="Filter Missing att 2" to_port="example set input"/>
<connect from_op="Filter Missing att 2" from_port="example set output" to_op="Apply Model" to_port="unlabelled data"/>
<connect from_op="Apply Model" from_port="labelled data" to_op="Join" to_port="left"/>
<connect from_op="Apply Model" from_port="model" to_port="result 1"/>
<connect from_op="Join" from_port="join" to_op="Select Final Set" to_port="example set input"/>
<connect from_op="Select Final Set" from_port="example set output" to_op="Store" to_port="input"/>
<connect from_op="Store" from_port="through" to_port="result 2"/>
<portSpacing port="source_input 1" spacing="0"/>
<portSpacing port="sink_result 1" spacing="0"/>
<portSpacing port="sink_result 2" spacing="0"/>
<portSpacing port="sink_result 3" spacing="0"/>
</process>
</operator>
</process>
Use RapidMiner to Find Interesting Twitter Content and Trends
Welcome to this new tutorial on how to use RapidMiner to discover Twitter Content. I created this process as a way to monitor what’s going on in the Twitter universe and see what topics are being tweeted about. Could I do this in Python scripts? Yes, but that would be a big waste of time for me. RapidMiner makes complex ETL and tasks simple, so I live and breathe it.
Why this process?
Back when I was in Product Marketing, I had to come up with many different blog posts and ‘collateral’ to help push the RapidMiner cause. I monitor what goes on on KD Nuggets, DataScience Central, and of course Twitter. I thought, it would be fun to extract key terms and subjects from Twitter (and later websites) to see what’s currently popular and help make a ‘bigger splash’ when we publish something new. I’ve since applied this model to my new website Yeast Head to see what beer brewing lifestyle bloggers are posting about. The short end of that discussion is that the terms ‘#recipes’ and ‘#homebrew_#recipes’ are most popular. So I need to make sure to include some recipies going forward. Interestingly enough, there’s a lot of retweets with respect to Homebrewer’s Association, so I’ll be exploiting that for sure.
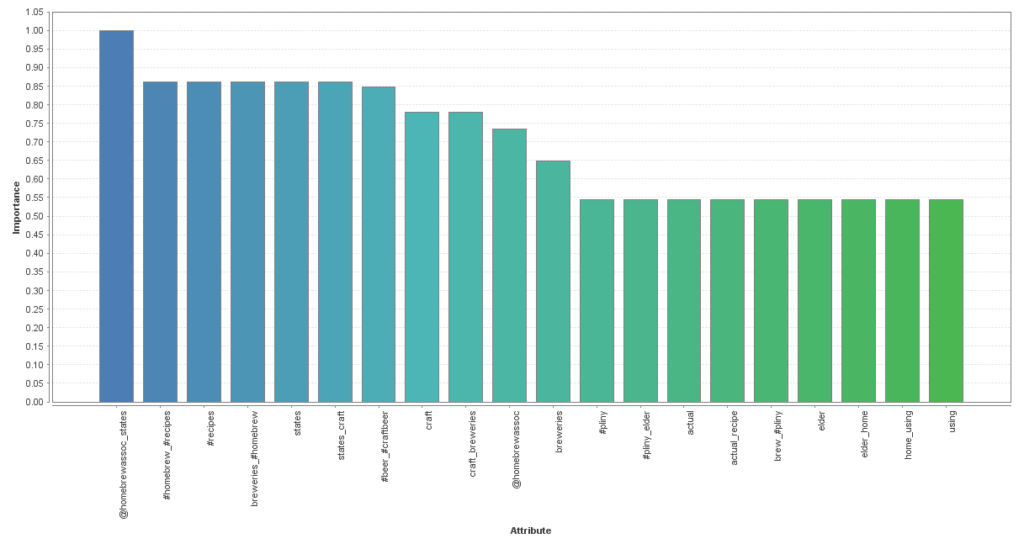
The Process Design
This process utilizes RapidMiner’s text processing extension, X-means clustering, association rules, and a bunch of averaged attribute weighting schemes. Since I’m not scoring any incoming tweets (this will be a later task) to see if any new tweets are important/not important, I didn’t do any classification analysis. I did create a temporary label called “Important/Not Important” based on a simple rule that if Retweets > 10, then it has to be important. This is a problem because I don’t know what the actual retweet number threshold is for important (aka viral tweets) and my attribute weight chart (as above) will be a bit suspect, but it’s a start I suppose.
The Process
<?xml version="1.0" encoding="UTF-8"?><process version="7.5.003">
<context>
<input/>
<output/>
<macros/>
</context>
<operator activated="true" class="process" compatibility="7.5.003" expanded="true" name="Process">
<parameter key="encoding" value="SYSTEM"/>
<process expanded="true">
<operator activated="true" class="subprocess" compatibility="7.5.003" expanded="true" height="82" name="Retrieve Twitter Data" width="90" x="45" y="34">
<process expanded="true">
<operator activated="true" class="set_macros" compatibility="7.5.003" expanded="true" height="68" name="Set Macros" width="90" x="45" y="34">
<list key="macros">
<parameter key="keyword1" value="#machinelearning"/>
<parameter key="keyword2" value="#datascience"/>
<parameter key="keyword3" value="#ai"/>
<parameter key="date" value="2017.08.08"/>
<parameter key="retweetcount" value="5"/>
</list>
<description align="center" color="transparent" colored="false" width="126">Set global variables here. Such as keyword search.</description>
</operator>
<operator activated="false" class="retrieve" compatibility="7.5.003" expanded="true" height="68" name="Retrieve Twitter Content Ideas" width="90" x="179" y="340">
<parameter key="repository_entry" value="../data/%{keyword1} Twitter Content Ideas"/>
</operator>
<operator activated="true" class="social_media:search_twitter" compatibility="7.3.000" expanded="true" height="68" name="Search Twitter for Keyword3" width="90" x="179" y="238">
<parameter key="connection" value="Twitter - Studio Connection"/>
<parameter key="query" value="%{keyword3}"/>
<parameter key="limit" value="3000"/>
<parameter key="language" value="en"/>
<parameter key="until" value="%{date} 23:59:59 -0500"/>
</operator>
<operator activated="true" class="social_media:search_twitter" compatibility="7.3.000" expanded="true" height="68" name="Search Twitter for Keyword2" width="90" x="179" y="136">
<parameter key="connection" value="Twitter - Studio Connection"/>
<parameter key="query" value="%{keyword2}"/>
<parameter key="limit" value="3000"/>
<parameter key="language" value="en"/>
<parameter key="until" value="%{date} 23:59:59 -0500"/>
</operator>
<operator activated="true" class="social_media:search_twitter" compatibility="7.3.000" expanded="true" height="68" name="Search Twitter for Keyword 1" width="90" x="179" y="34">
<parameter key="connection" value="Twitter - Studio Connection"/>
<parameter key="query" value="%{keyword1}"/>
<parameter key="limit" value="3000"/>
<parameter key="language" value="en"/>
<parameter key="until" value="%{date} 23:59:59 -0500"/>
</operator>
<operator activated="true" class="append" compatibility="7.5.003" expanded="true" height="145" name="Append Data Set together" width="90" x="447" y="34"/>
<operator activated="true" class="remove_duplicates" compatibility="7.5.003" expanded="true" height="103" name="Remove Duplicate IDs" width="90" x="581" y="34">
<parameter key="attribute_filter_type" value="single"/>
<parameter key="attribute" value="Id"/>
<parameter key="include_special_attributes" value="true"/>
</operator>
<operator activated="true" class="store" compatibility="7.5.003" expanded="true" height="68" name="Store Data for later reuse" width="90" x="715" y="34">
<parameter key="repository_entry" value="../data/%{keyword1} Twitter Content Ideas"/>
</operator>
<connect from_op="Search Twitter for Keyword3" from_port="output" to_op="Append Data Set together" to_port="example set 3"/>
<connect from_op="Search Twitter for Keyword2" from_port="output" to_op="Append Data Set together" to_port="example set 2"/>
<connect from_op="Search Twitter for Keyword 1" from_port="output" to_op="Append Data Set together" to_port="example set 1"/>
<connect from_op="Append Data Set together" from_port="merged set" to_op="Remove Duplicate IDs" to_port="example set input"/>
<connect from_op="Remove Duplicate IDs" from_port="example set output" to_op="Store Data for later reuse" to_port="input"/>
<connect from_op="Store Data for later reuse" from_port="through" to_port="out 1"/>
<portSpacing port="source_in 1" spacing="0"/>
<portSpacing port="sink_out 1" spacing="0"/>
<portSpacing port="sink_out 2" spacing="0"/>
</process>
<description align="center" color="transparent" colored="false" width="126">Retrieves Twitter Data, Appends, and Stores</description>
</operator>
<operator activated="true" class="subprocess" compatibility="7.5.003" expanded="true" height="82" name="ETL Subprocess" width="90" x="179" y="34">
<process expanded="true">
<operator activated="true" class="remove_duplicates" compatibility="7.5.003" expanded="true" height="103" name="Remove Duplicates" width="90" x="45" y="34">
<parameter key="attribute_filter_type" value="single"/>
<parameter key="attribute" value="From-User"/>
<description align="center" color="transparent" colored="false" width="126">Remove Duplicate Tweets from same user</description>
</operator>
<operator activated="true" class="generate_attributes" compatibility="7.5.003" expanded="true" height="82" name="Generate Arbitrary Label" width="90" x="179" y="34">
<list key="function_descriptions">
<parameter key="label" value="if([Retweet-Count]<eval(%{retweetcount}),"Not Important","Important")"/>
</list>
</operator>
<operator activated="false" class="filter_examples" compatibility="7.5.003" expanded="true" height="103" name="Filter Examples" width="90" x="313" y="34">
<parameter key="invert_filter" value="true"/>
<list key="filters_list">
<parameter key="filters_entry_key" value="Text.contains.RT"/>
</list>
</operator>
<operator activated="true" class="set_role" compatibility="7.5.003" expanded="true" height="82" name="Set Role" width="90" x="447" y="34">
<parameter key="attribute_name" value="label"/>
<parameter key="target_role" value="label"/>
<list key="set_additional_roles"/>
<description align="center" color="transparent" colored="false" width="126">Set Role for Label</description>
</operator>
<operator activated="true" class="select_attributes" compatibility="7.5.003" expanded="true" height="82" name="Select Attributes" width="90" x="581" y="34">
<parameter key="attribute_filter_type" value="subset"/>
<parameter key="attributes" value="Text|label"/>
<parameter key="include_special_attributes" value="true"/>
</operator>
<operator activated="true" class="nominal_to_text" compatibility="7.5.003" expanded="true" height="82" name="Nominal to Text" width="90" x="715" y="34">
<parameter key="attribute_filter_type" value="single"/>
<parameter key="attribute" value="Text"/>
</operator>
<operator activated="true" class="extract_macro" compatibility="7.5.003" expanded="true" height="68" name="Extract Macro (3)" width="90" x="849" y="34">
<parameter key="macro" value="label_count"/>
<parameter key="macro_type" value="statistics"/>
<parameter key="statistics" value="count"/>
<parameter key="attribute_name" value="label"/>
<parameter key="attribute_value" value="Important"/>
<list key="additional_macros"/>
</operator>
<connect from_port="in 1" to_op="Remove Duplicates" to_port="example set input"/>
<connect from_op="Remove Duplicates" from_port="example set output" to_op="Generate Arbitrary Label" to_port="example set input"/>
<connect from_op="Generate Arbitrary Label" from_port="example set output" to_op="Set Role" to_port="example set input"/>
<connect from_op="Set Role" from_port="example set output" to_op="Select Attributes" to_port="example set input"/>
<connect from_op="Select Attributes" from_port="example set output" to_op="Nominal to Text" to_port="example set input"/>
<connect from_op="Nominal to Text" from_port="example set output" to_op="Extract Macro (3)" to_port="example set"/>
<connect from_op="Extract Macro (3)" from_port="example set" to_port="out 1"/>
<portSpacing port="source_in 1" spacing="0"/>
<portSpacing port="source_in 2" spacing="0"/>
<portSpacing port="sink_out 1" spacing="0"/>
<portSpacing port="sink_out 2" spacing="0"/>
</process>
<description align="center" color="transparent" colored="false" width="126">Binning for Label subprocess - suspect</description>
</operator>
<operator activated="true" class="text:process_document_from_data" compatibility="7.5.000" expanded="true" height="82" name="Process Documents from Data" width="90" x="313" y="34">
<parameter key="prune_method" value="percentual"/>
<parameter key="prune_below_percent" value="5.0"/>
<parameter key="prune_above_percent" value="50.0"/>
<parameter key="prune_below_absolute" value="100"/>
<parameter key="prune_above_absolute" value="500"/>
<list key="specify_weights"/>
<process expanded="true">
<operator activated="true" class="text:extract_information" compatibility="7.5.000" expanded="true" height="68" name="Extract Links for later use" width="90" x="45" y="34">
<parameter key="query_type" value="Regular Expression"/>
<list key="string_machting_queries"/>
<list key="regular_expression_queries">
<parameter key="Tweet Links" value="http.*"/>
</list>
<list key="regular_region_queries"/>
<list key="xpath_queries"/>
<list key="namespaces"/>
<list key="index_queries"/>
<list key="jsonpath_queries"/>
</operator>
<operator activated="true" class="text:replace_tokens" compatibility="7.5.000" expanded="true" height="68" name="Replace http links" width="90" x="179" y="34">
<list key="replace_dictionary">
<parameter key="http.*" value="link"/>
</list>
</operator>
<operator activated="true" class="text:tokenize" compatibility="7.5.000" expanded="true" height="68" name="Tokenize" width="90" x="313" y="34">
<parameter key="mode" value="specify characters"/>
<parameter key="characters" value=" .!;:[,' ?]"/>
</operator>
<operator activated="true" class="text:transform_cases" compatibility="7.5.000" expanded="true" height="68" name="Transform Cases" width="90" x="447" y="34"/>
<operator activated="true" class="text:filter_by_length" compatibility="7.5.000" expanded="true" height="68" name="Filter Tokens (by Length)" width="90" x="581" y="34"/>
<operator activated="true" class="text:generate_n_grams_terms" compatibility="7.5.000" expanded="true" height="68" name="Generate n-Grams (Terms)" width="90" x="715" y="34"/>
<operator activated="true" class="text:filter_tokens_by_content" compatibility="7.5.000" expanded="true" height="68" name="Filter Tokens (by Content)" width="90" x="849" y="34">
<parameter key="string" value="link"/>
<parameter key="invert condition" value="true"/>
</operator>
<operator activated="true" class="text:filter_stopwords_english" compatibility="7.5.000" expanded="true" height="68" name="Filter Stopwords (English)" width="90" x="983" y="34"/>
<connect from_port="document" to_op="Extract Links for later use" to_port="document"/>
<connect from_op="Extract Links for later use" from_port="document" to_op="Replace http links" to_port="document"/>
<connect from_op="Replace http links" from_port="document" to_op="Tokenize" to_port="document"/>
<connect from_op="Tokenize" from_port="document" to_op="Transform Cases" to_port="document"/>
<connect from_op="Transform Cases" from_port="document" to_op="Filter Tokens (by Length)" to_port="document"/>
<connect from_op="Filter Tokens (by Length)" from_port="document" to_op="Generate n-Grams (Terms)" to_port="document"/>
<connect from_op="Generate n-Grams (Terms)" from_port="document" to_op="Filter Tokens (by Content)" to_port="document"/>
<connect from_op="Filter Tokens (by Content)" from_port="document" to_op="Filter Stopwords (English)" to_port="document"/>
<connect from_op="Filter Stopwords (English)" from_port="document" to_port="document 1"/>
<portSpacing port="source_document" spacing="0"/>
<portSpacing port="sink_document 1" spacing="0"/>
<portSpacing port="sink_document 2" spacing="0"/>
</process>
</operator>
<operator activated="true" class="multiply" compatibility="7.5.003" expanded="true" height="103" name="Multiply" width="90" x="447" y="34"/>
<operator activated="true" class="subprocess" compatibility="7.5.003" expanded="true" height="103" name="Clustering Stuff" width="90" x="581" y="34">
<process expanded="true">
<operator activated="true" class="select_attributes" compatibility="7.5.003" expanded="true" height="82" name="Remove Tweet Links" width="90" x="45" y="34">
<parameter key="attribute_filter_type" value="single"/>
<parameter key="attribute" value="Tweet Links"/>
<parameter key="attributes" value="Tweet Links"/>
<parameter key="invert_selection" value="true"/>
</operator>
<operator activated="true" class="x_means" compatibility="7.5.003" expanded="true" height="82" name="X-Means" width="90" x="179" y="34">
<parameter key="measure_types" value="BregmanDivergences"/>
<parameter key="divergence" value="SquaredEuclideanDistance"/>
</operator>
<operator activated="true" class="extract_prototypes" compatibility="7.5.003" expanded="true" height="82" name="Extract Cluster Prototypes" width="90" x="313" y="136"/>
<operator activated="true" class="store" compatibility="7.5.003" expanded="true" height="68" name="Store Cluster Model" width="90" x="447" y="34">
<parameter key="repository_entry" value="../results/%{keyword1} Twitter Content Cluster Model"/>
</operator>
<connect from_port="in 1" to_op="Remove Tweet Links" to_port="example set input"/>
<connect from_op="Remove Tweet Links" from_port="example set output" to_op="X-Means" to_port="example set"/>
<connect from_op="X-Means" from_port="cluster model" to_op="Extract Cluster Prototypes" to_port="model"/>
<connect from_op="Extract Cluster Prototypes" from_port="example set" to_op="Store Cluster Model" to_port="input"/>
<connect from_op="Extract Cluster Prototypes" from_port="model" to_port="out 2"/>
<connect from_op="Store Cluster Model" from_port="through" to_port="out 1"/>
<portSpacing port="source_in 1" spacing="0"/>
<portSpacing port="source_in 2" spacing="0"/>
<portSpacing port="sink_out 1" spacing="0"/>
<portSpacing port="sink_out 2" spacing="0"/>
<portSpacing port="sink_out 3" spacing="0"/>
</process>
</operator>
<operator activated="true" class="store" compatibility="7.5.003" expanded="true" height="68" name="Store WordList" width="90" x="447" y="289">
<parameter key="repository_entry" value="../results/%{keyword1} Twitter Content Ideas Wordlist"/>
</operator>
<operator activated="true" class="text:wordlist_to_data" compatibility="7.5.000" expanded="true" height="82" name="WordList to Data" width="90" x="581" y="289"/>
<operator activated="true" class="sort" compatibility="7.5.003" expanded="true" height="82" name="Sort" width="90" x="715" y="289">
<parameter key="attribute_name" value="total"/>
<parameter key="sorting_direction" value="decreasing"/>
</operator>
<operator activated="true" class="select_attributes" compatibility="7.5.003" expanded="true" height="82" name="Remove Tweet Links (2)" width="90" x="581" y="136">
<parameter key="attribute_filter_type" value="single"/>
<parameter key="attribute" value="Tweet Links"/>
<parameter key="attributes" value="Tweet Links"/>
<parameter key="invert_selection" value="true"/>
</operator>
<operator activated="true" class="subprocess" compatibility="7.5.003" expanded="true" height="82" name="Determine Influence Factors" width="90" x="715" y="136">
<process expanded="true">
<operator activated="true" class="weight_by_correlation" compatibility="7.5.003" expanded="true" height="82" name="Weight by Correlation" width="90" x="45" y="34"/>
<operator activated="true" class="weights_to_data" compatibility="7.5.003" expanded="true" height="68" name="Weights to Data" width="90" x="179" y="34"/>
<operator activated="true" class="generate_attributes" compatibility="6.4.000" expanded="true" height="82" name="Generate Attributes (2)" width="90" x="313" y="34">
<list key="function_descriptions">
<parameter key="Method" value=""Correlation""/>
</list>
</operator>
<operator activated="true" class="weight_by_gini_index" compatibility="7.5.003" expanded="true" height="82" name="Weight by Gini Index" width="90" x="45" y="120"/>
<operator activated="true" class="weight_by_information_gain" compatibility="7.5.003" expanded="true" height="82" name="Weight by Information Gain" width="90" x="45" y="210"/>
<operator activated="true" class="weight_by_information_gain_ratio" compatibility="7.5.003" expanded="true" height="82" name="Weight by Information Gain Ratio" width="90" x="45" y="300"/>
<operator activated="true" class="weights_to_data" compatibility="7.5.003" expanded="true" height="68" name="Weights to Data (2)" width="90" x="179" y="120"/>
<operator activated="true" class="generate_attributes" compatibility="6.4.000" expanded="true" height="82" name="Generate Attributes (3)" width="90" x="313" y="120">
<list key="function_descriptions">
<parameter key="Method" value=""Gini""/>
</list>
</operator>
<operator activated="true" class="weights_to_data" compatibility="7.5.003" expanded="true" height="68" name="Weights to Data (3)" width="90" x="179" y="210"/>
<operator activated="true" class="generate_attributes" compatibility="6.4.000" expanded="true" height="82" name="Generate Attributes (4)" width="90" x="313" y="210">
<list key="function_descriptions">
<parameter key="Method" value=""InfoGain""/>
</list>
</operator>
<operator activated="true" class="weights_to_data" compatibility="7.5.003" expanded="true" height="68" name="Weights to Data (4)" width="90" x="179" y="300"/>
<operator activated="true" class="generate_attributes" compatibility="6.4.000" expanded="true" height="82" name="Generate Attributes (5)" width="90" x="313" y="300">
<list key="function_descriptions">
<parameter key="Method" value=""InfoGainRatio""/>
</list>
</operator>
<operator activated="true" class="append" compatibility="7.5.003" expanded="true" height="145" name="Append" width="90" x="447" y="30"/>
<operator activated="true" class="pivot" compatibility="7.5.003" expanded="true" height="82" name="Pivot" width="90" x="581" y="30">
<parameter key="group_attribute" value="Attribute"/>
<parameter key="index_attribute" value="Method"/>
</operator>
<operator activated="true" class="generate_aggregation" compatibility="6.5.002" expanded="true" height="82" name="Generate Aggregation" width="90" x="715" y="30">
<parameter key="attribute_name" value="Importance"/>
<parameter key="attribute_filter_type" value="value_type"/>
<parameter key="value_type" value="numeric"/>
<parameter key="aggregation_function" value="average"/>
</operator>
<operator activated="true" class="normalize" compatibility="7.5.003" expanded="true" height="103" name="Normalize" width="90" x="849" y="30">
<parameter key="attribute_filter_type" value="single"/>
<parameter key="attribute" value="Importance"/>
<parameter key="method" value="range transformation"/>
</operator>
<operator activated="true" class="sort" compatibility="7.5.003" expanded="true" height="82" name="Sort again" width="90" x="983" y="34">
<parameter key="attribute_name" value="Importance"/>
<parameter key="sorting_direction" value="decreasing"/>
</operator>
<operator activated="true" class="order_attributes" compatibility="7.5.003" expanded="true" height="82" name="Reorder Attributes" width="90" x="1117" y="34">
<parameter key="attribute_ordering" value="Attribute|Importance"/>
<parameter key="handle_unmatched" value="remove"/>
</operator>
<operator activated="true" class="filter_example_range" compatibility="7.5.003" expanded="true" height="82" name="Select Top 20" width="90" x="1251" y="34">
<parameter key="first_example" value="1"/>
<parameter key="last_example" value="20"/>
</operator>
<connect from_port="in 1" to_op="Weight by Correlation" to_port="example set"/>
<connect from_op="Weight by Correlation" from_port="weights" to_op="Weights to Data" to_port="attribute weights"/>
<connect from_op="Weight by Correlation" from_port="example set" to_op="Weight by Gini Index" to_port="example set"/>
<connect from_op="Weights to Data" from_port="example set" to_op="Generate Attributes (2)" to_port="example set input"/>
<connect from_op="Generate Attributes (2)" from_port="example set output" to_op="Append" to_port="example set 1"/>
<connect from_op="Weight by Gini Index" from_port="weights" to_op="Weights to Data (2)" to_port="attribute weights"/>
<connect from_op="Weight by Gini Index" from_port="example set" to_op="Weight by Information Gain" to_port="example set"/>
<connect from_op="Weight by Information Gain" from_port="weights" to_op="Weights to Data (3)" to_port="attribute weights"/>
<connect from_op="Weight by Information Gain" from_port="example set" to_op="Weight by Information Gain Ratio" to_port="example set"/>
<connect from_op="Weight by Information Gain Ratio" from_port="weights" to_op="Weights to Data (4)" to_port="attribute weights"/>
<connect from_op="Weights to Data (2)" from_port="example set" to_op="Generate Attributes (3)" to_port="example set input"/>
<connect from_op="Generate Attributes (3)" from_port="example set output" to_op="Append" to_port="example set 2"/>
<connect from_op="Weights to Data (3)" from_port="example set" to_op="Generate Attributes (4)" to_port="example set input"/>
<connect from_op="Generate Attributes (4)" from_port="example set output" to_op="Append" to_port="example set 3"/>
<connect from_op="Weights to Data (4)" from_port="example set" to_op="Generate Attributes (5)" to_port="example set input"/>
<connect from_op="Generate Attributes (5)" from_port="example set output" to_op="Append" to_port="example set 4"/>
<connect from_op="Append" from_port="merged set" to_op="Pivot" to_port="example set input"/>
<connect from_op="Pivot" from_port="example set output" to_op="Generate Aggregation" to_port="example set input"/>
<connect from_op="Generate Aggregation" from_port="example set output" to_op="Normalize" to_port="example set input"/>
<connect from_op="Normalize" from_port="example set output" to_op="Sort again" to_port="example set input"/>
<connect from_op="Sort again" from_port="example set output" to_op="Reorder Attributes" to_port="example set input"/>
<connect from_op="Reorder Attributes" from_port="example set output" to_op="Select Top 20" to_port="example set input"/>
<connect from_op="Select Top 20" from_port="example set output" to_port="out 1"/>
<portSpacing port="source_in 1" spacing="0"/>
<portSpacing port="source_in 2" spacing="0"/>
<portSpacing port="sink_out 1" spacing="0"/>
<portSpacing port="sink_out 2" spacing="0"/>
</process>
</operator>
<operator activated="true" class="store" compatibility="7.5.003" expanded="true" height="68" name="Store Influence Wrds" width="90" x="849" y="136">
<parameter key="repository_entry" value="../results/%{keyword1} Twitter Content Influence Words"/>
</operator>
<operator activated="true" class="write_excel" compatibility="7.5.003" expanded="true" height="82" name="Write Important Words" width="90" x="983" y="136">
<parameter key="excel_file" value="C:\Users\Thomas Ott\Dropbox\Twitter Influencers\%{keyword1} Todays Powerful Words to use in your Tweets.xlsx"/>
</operator>
<connect from_op="Retrieve Twitter Data" from_port="out 1" to_op="ETL Subprocess" to_port="in 1"/>
<connect from_op="ETL Subprocess" from_port="out 1" to_op="Process Documents from Data" to_port="example set"/>
<connect from_op="Process Documents from Data" from_port="example set" to_op="Multiply" to_port="input"/>
<connect from_op="Process Documents from Data" from_port="word list" to_op="Store WordList" to_port="input"/>
<connect from_op="Multiply" from_port="output 1" to_op="Clustering Stuff" to_port="in 1"/>
<connect from_op="Multiply" from_port="output 2" to_op="Remove Tweet Links (2)" to_port="example set input"/>
<connect from_op="Clustering Stuff" from_port="out 1" to_port="result 1"/>
<connect from_op="Clustering Stuff" from_port="out 2" to_port="result 2"/>
<connect from_op="Store WordList" from_port="through" to_op="WordList to Data" to_port="word list"/>
<connect from_op="WordList to Data" from_port="example set" to_op="Sort" to_port="example set input"/>
<connect from_op="Sort" from_port="example set output" to_port="result 4"/>
<connect from_op="Remove Tweet Links (2)" from_port="example set output" to_op="Determine Influence Factors" to_port="in 1"/>
<connect from_op="Determine Influence Factors" from_port="out 1" to_op="Store Influence Wrds" to_port="input"/>
<connect from_op="Store Influence Wrds" from_port="through" to_op="Write Important Words" to_port="input"/>
<connect from_op="Write Important Words" from_port="through" to_port="result 3"/>
<portSpacing port="source_input 1" spacing="0"/>
<portSpacing port="sink_result 1" spacing="0"/>
<portSpacing port="sink_result 2" spacing="63"/>
<portSpacing port="sink_result 3" spacing="126"/>
<portSpacing port="sink_result 4" spacing="84"/>
<portSpacing port="sink_result 5" spacing="0"/>
</process>
</operator>
</process>
For this particular process I shared, I used a Macro to set the search terms to #machinelearning, #datascience, and #ai. When you run this process over and over, you’ll see some interesting Tweeters emerge.
Next Steps
My next steps are to figure out the actual retweet # that truly indicates whether a tweet is important and viral and what is not. I might write a one class auto-labeling process or just hand label some important and non-important tweets. That will hone down the process and let me really figure out what his the best number to watch.
Extract Author Quotes with RapidMiner
Here’s a fast and simple process to extract Ernst Hemingway Quotes from Goodreads. The process is not done, I still need to loop over each quote and add 1 day to the %{now} macro. The goal is to then write them in markdown with %{now}+1 day and auto schedule them on my other website (thomasott.io).
Right now the Goodreads.com web structure is easy to extract but I suspect they’ll make it harder one day.
<?xml version="1.0" encoding="UTF-8"?><process version="8.1.000">
<context>
<input/>
<output/>
<macros/>
</context>
<operator activated="true" class="process" compatibility="8.1.000" expanded="true" name="Process">
<process expanded="true">
<operator activated="true" class="generate_data_user_specification" compatibility="8.1.000" expanded="true" height="68" name="Generate Data by User Specification" width="90" x="45" y="34">
<list key="attribute_values">
<parameter key="get_date" value="date_now()"/>
</list>
<list key="set_additional_roles"/>
</operator>
<operator activated="true" class="date_to_nominal" compatibility="8.1.000" expanded="true" height="82" name="Date to Nominal" width="90" x="179" y="34">
<parameter key="attribute_name" value="get_date"/>
<parameter key="date_format" value="yyyy-MM-dd"/>
</operator>
<operator activated="true" class="extract_macro" compatibility="8.1.000" expanded="true" height="68" name="Extract Macro" width="90" x="313" y="34">
<parameter key="macro" value="now"/>
<parameter key="macro_type" value="data_value"/>
<parameter key="attribute_name" value="get_date"/>
<parameter key="example_index" value="1"/>
<list key="additional_macros"/>
</operator>
<operator activated="true" class="web:get_webpage" compatibility="7.3.000" expanded="true" height="68" name="Get Page" width="90" x="447" y="34">
<parameter key="url" value="https://www.goodreads.com/work/quotes/2459084-a-moveable-feast"/>
<list key="query_parameters"/>
<list key="request_properties"/>
<description align="center" color="transparent" colored="false" width="126">Read Moveable Feast Quotes</description>
</operator>
<operator activated="true" class="text:cut_document" compatibility="8.1.000" expanded="true" height="68" name="Cut Document" width="90" x="581" y="34">
<list key="string_machting_queries">
<parameter key="MoveableFeastQuotes" value="<div class="quoteText">.</div>"/>
</list>
<list key="regular_expression_queries"/>
<list key="regular_region_queries"/>
<list key="xpath_queries">
<parameter key="<div class ="quoteText">" value="</div>"/>
</list>
<list key="namespaces"/>
<list key="index_queries"/>
<list key="jsonpath_queries"/>
<process expanded="true">
<operator activated="true" class="web:extract_html_text_content" compatibility="7.3.000" expanded="true" height="68" name="Extract Content" width="90" x="45" y="34"/>
<operator activated="true" class="text:extract_information" compatibility="8.1.000" expanded="true" height="68" name="Extract Information" width="90" x="179" y="34">
<parameter key="query_type" value="Regular Expression"/>
<list key="string_machting_queries">
<parameter key="QuoteText" value="".""/>
</list>
<list key="regular_expression_queries">
<parameter key="QuoteText" value="\".*\""/>
</list>
<list key="regular_region_queries"/>
<list key="xpath_queries"/>
<list key="namespaces"/>
<list key="index_queries"/>
<list key="jsonpath_queries"/>
</operator>
<operator activated="true" class="text:documents_to_data" compatibility="8.1.000" expanded="true" height="82" name="Documents to Data" width="90" x="313" y="34">
<parameter key="text_attribute" value="ExtractedText"/>
</operator>
<operator activated="true" class="extract_macro" compatibility="8.1.000" expanded="true" height="68" name="Extract Quote" width="90" x="447" y="34">
<parameter key="macro" value="Quote"/>
<parameter key="macro_type" value="data_value"/>
<parameter key="attribute_name" value="ExtractedText"/>
<parameter key="example_index" value="1"/>
<list key="additional_macros"/>
</operator>
<operator activated="true" class="text:create_document" compatibility="8.1.000" expanded="true" height="68" name="Create Document" width="90" x="648" y="34">
<parameter key="text" value="---
title: Hemingway Quote for %{now} date: %{now} #Hemingway Quote for %{now} %{Quote}"/>
</operator>
<connect from_port="segment" to_op="Extract Content" to_port="document"/>
<connect from_op="Extract Content" from_port="document" to_op="Extract Information" to_port="document"/>
<connect from_op="Extract Information" from_port="document" to_op="Documents to Data" to_port="documents 1"/>
<connect from_op="Documents to Data" from_port="example set" to_op="Extract Quote" to_port="example set"/>
<connect from_op="Create Document" from_port="output" to_port="document 1"/>
<portSpacing port="source_segment" spacing="0"/>
<portSpacing port="sink_document 1" spacing="0"/>
<portSpacing port="sink_document 2" spacing="0"/>
</process>
</operator>
<connect from_op="Generate Data by User Specification" from_port="output" to_op="Date to Nominal" to_port="example set input"/>
<connect from_op="Date to Nominal" from_port="example set output" to_op="Extract Macro" to_port="example set"/>
<connect from_op="Get Page" from_port="output" to_op="Cut Document" to_port="document"/>
<connect from_op="Cut Document" from_port="documents" to_port="result 1"/>
<portSpacing port="source_input 1" spacing="0"/>
<portSpacing port="sink_result 1" spacing="0"/>
<portSpacing port="sink_result 2" spacing="0"/>
</process>
</operator>
</process>
Using Julia with RapidMiner
If you want to execute any Python in RapidMiner, you have to use the Execute Python operator. This operator makes things so simple that people use the hell out o fit. However, it wasn’t so simple in the “old days.” It could still be done but it required more effort, and that’s what I did with the Julia Language. I mashed up the Julia Language with RapidMiner with only a few extra steps.
The way we mashed up other programs and languages in the old days was to use the Execute Program operator. That operator let’s you execute arbitrary programs in RapidMiner within the process. Want to kick of some Java at run time? You could do it. Want to use Python? You could do that (and I did) too!
The best part? You can still use this operator today and that’s what I did with Julia. Mind you, this is tutorial is a simple Proof of Concept, I didn’t do anything fancy, but it works.
What I did was take some a RapidMiner sample data set (Golf) and pass it to a Julia script that writes it out as a CSV file. I save the CSV file to a working directory defined by the Julia script.
Tutorial Processes
A few prerequisites, you’ll need RapidMiner and Julia installed. Make sure your Julia path is correct in your environment variables. I had some trouble in Windows with this but it worked fine after I fixed it.
Below you’ll find the XML for the Rapidminer process and the simple Julia script. I named the script read.jl and called from my Dropbox, you’ll need to repath this on your computer.
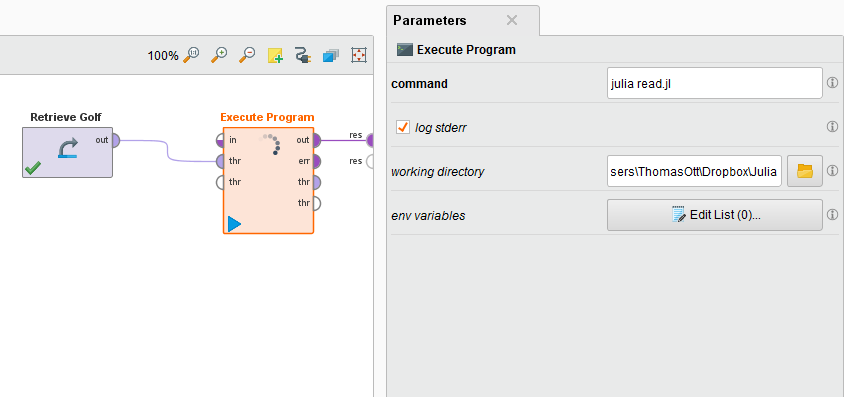
The RapidMiner Process
<?xml version="1.0" encoding="UTF-8"?><process version="7.4.000">
  <context>
    <input/>
    <output/>
    <macros/>
  </context>
  <operator activated="true" class="process" compatibility="7.4.000" expanded="true" name="Process">
    <process expanded="true">
      <operator activated="true" class="retrieve" compatibility="7.4.000" expanded="true" height="68" name="Retrieve Golf" width="90" x="45" y="34">
        <parameter key="repository_entry" value="//Samples/data/Golf"/>
      </operator>
      <operator activated="true" class="write_csv" compatibility="7.4.000" expanded="true" height="82" name="Write CSV" width="90" x="246" y="34">
        <parameter key="csv_file" value="read"/>
        <parameter key="column_separator" value=","/>
      </operator>
      <operator activated="true" class="productivity:execute_program" compatibility="7.4.000" expanded="true" height="103" name="Execute Program" width="90" x="447" y="34">
        <parameter key="command" value="julia read.jl"/>
        <parameter key="working_directory" value="C:\Users\ThomasOtt\Dropbox\Julia"/>
        <list key="env_variables"/>
      </operator>
      <connect from_op="Retrieve Golf" from_port="output" to_op="Write CSV" to_port="input"/>
      <connect from_op="Write CSV" from_port="file" to_op="Execute Program" to_port="in"/>
      <connect from_op="Execute Program" from_port="out" to_port="result 1"/>
      <portSpacing port="source_input 1" spacing="0"/>
      <portSpacing port="sink_result 1" spacing="0"/>
      <portSpacing port="sink_result 2" spacing="0"/>
    </process>
  </operator>
</process>
The Julia Language script
using DataFrames

df = readtable(STDIN)

writetable("output.csv", df, separator = ',', header = true)
Note: You’ll need to “Pkg.add(“Dataframes”)” to Julia first.
Of course the next steps is to write a more defined Julia script, pass the data back INTO RapidMiner, and then continue processing it downstream.
Stock Trend Following Model in RapidMiner
Recently I discovered in my old archives a stock trend following model I started in RapidMiner. I never finished it back then but now I cleaned it up. I’m releasing it to the world as beta (use at your own risk) and will probably have some “bugs” in it. The trend following model is based on Blackstar Funds, LLC paper “Does Trend Following Work on Stocks?”
The process is not production ready and there are some clean up things I need to do. I need to write a function that will cleanly output the ATR stops so I can chart them like in the paper.
Of course, the ultimate goal is to loop over a daily list of 52 week new highs and spit out recommendations, but that’s for another post and another process altogether.
Please note, you’ll need the Finance/Economics and Series extensions. You can get them at the RapidMiner marketplace.
<?xml version="1.0" encoding="UTF-8" standalone="no"?>
<process version="7.1.001">
<context>
<input/>
<output/>
<macros>
<macro>
<key>period</key>
<value>25</value>
</macro>
<macro>
<key>symbol</key>
<value>PAAS</value>
</macro>
<macro>
<key>start_date</key>
<value>2014-01-01</value>
</macro>
<macro>
<key>end_date</key>
<value>2016-05-20</value>
</macro>
<macro>
<key>shares</key>
<value>10</value>
</macro>
</macros>
</context>
<operator activated="true" class="process" compatibility="7.1.001" expanded="true" name="Process">
<process expanded="true">
<operator activated="true" class="quantx1:yahoo_historical_data_extractor" compatibility="1.0.006" expanded="true" height="82" name="Yahoo Historical Stock Data" width="90" x="45" y="34">
<parameter key="I agree to abide by Yahoo's Terms & Conditions on financial data usage" value="true"/>
<parameter key="Quick Stock Ticker Data" value="true"/>
<parameter key="Stock Ticker" value="%{symbol}"/>
<parameter key="select_fields" value="VOLUME|OPEN|DAY_LOW|DAY_HIGH|CLOSE|ADJUSTED_CLOSE"/>
<parameter key="date_format" value="yyyy-MM-dd"/>
<parameter key="date_start" value="%{start_date}"/>
<parameter key="date_end" value="%{end_date}"/>
<parameter key="Cache Data in Memory" value="true"/>
</operator>
<operator activated="true" class="rename" compatibility="7.1.001" expanded="true" height="82" name="Rename" width="90" x="45" y="187">
<parameter key="old_name" value="%{symbol}_CLOSE"/>
<parameter key="new_name" value="Close"/>
<list key="rename_additional_attributes">
<parameter key="%{symbol}_DAY_HIGH" value="High"/>
<parameter key="%{symbol}_DAY_LOW" value="Low"/>
<parameter key="%{symbol}_OPEN" value="Open"/>
<parameter key="%{symbol}_VOLUME" value="Volume"/>
</list>
</operator>
<operator activated="true" class="date_to_numerical" compatibility="7.1.001" expanded="true" height="82" name="Date to Numerical" width="90" x="179" y="187">
<parameter key="attribute_name" value="Date"/>
<parameter key="time_unit" value="day"/>
<parameter key="day_relative_to" value="week"/>
<parameter key="keep_old_attribute" value="true"/>
</operator>
<operator activated="true" class="filter_examples" compatibility="7.1.001" expanded="true" height="103" name="Filter Examples" width="90" x="313" y="187">
<list key="filters_list">
<parameter key="filters_entry_key" value="Date_day.eq.6"/>
</list>
</operator>
<operator activated="true" class="series:lag_series" compatibility="5.3.000" expanded="true" height="82" name="Lag Series" width="90" x="313" y="34">
<list key="attributes">
<parameter key="Close" value="1"/>
</list>
</operator>
<operator activated="true" class="generate_attributes" compatibility="7.1.001" expanded="true" height="82" name="Generate Attributes" width="90" x="447" y="34">
<list key="function_descriptions">
<parameter key="High_Low" value="High-Low"/>
<parameter key="Abs_High" value="abs(High-[Close-1])"/>
<parameter key="Abs_Low" value="abs(Low-[Close-1])"/>
<parameter key="TR" value="max(High_Low,Abs_High,Abs_Low)"/>
</list>
</operator>
<operator activated="true" class="series:moving_average" compatibility="5.3.000" expanded="true" height="82" name="Moving Average" width="90" x="581" y="34">
<parameter key="attribute_name" value="TR"/>
<parameter key="window_width" value="%{period}"/>
</operator>
<operator activated="true" class="generate_attributes" compatibility="7.1.001" expanded="true" height="82" name="Generate Attributes (2)" width="90" x="715" y="34">
<list key="function_descriptions">
<parameter key="Stop" value="Low-[average(TR)]"/>
</list>
</operator>
<operator activated="true" class="series:lag_series" compatibility="5.3.000" expanded="true" height="82" name="Lag Series (2)" width="90" x="849" y="34">
<list key="attributes">
<parameter key="Stop" value="1"/>
</list>
</operator>
<operator activated="true" class="generate_attributes" compatibility="7.1.001" expanded="true" height="82" name="Generate Attributes (3)" width="90" x="983" y="34">
<list key="function_descriptions">
<parameter key="Trend" value="if([Stop-1]<Stop,"UP","DOWN")"/>
</list>
</operator>
<operator activated="true" class="filter_example_range" compatibility="7.1.001" expanded="true" height="82" name="Filter Example Range" width="90" x="1117" y="34">
<parameter key="first_example" value="1"/>
<parameter key="last_example" value="%{period}"/>
<parameter key="invert_filter" value="true"/>
</operator>
<operator activated="true" class="series:lag_series" compatibility="5.3.000" expanded="true" height="82" name="Lag Series (3)" width="90" x="1251" y="34">
<list key="attributes">
<parameter key="Trend" value="1"/>
</list>
</operator>
<operator activated="true" class="generate_attributes" compatibility="7.1.001" expanded="true" height="82" name="Generate Attributes (4)" width="90" x="1251" y="238">
<list key="function_descriptions">
<parameter key="Rolling Cash" value="if((Trend=="UP" && [Trend-1]=="UP"), ((Close-[Close-1])*100), ((Close-[Close-1])*100))"/>
<parameter key="Signal" value="if((Trend=="UP") && ([Trend-1]=="UP") && ([Close-1]<Close),"Buy","Sell")"/>
</list>
</operator>
<operator activated="true" class="multiply" compatibility="7.1.001" expanded="true" height="103" name="Multiply" width="90" x="1385" y="238"/>
<operator activated="true" class="generate_attributes" compatibility="7.1.001" expanded="true" height="82" name="Generate Attributes (5)" width="90" x="1519" y="238">
<list key="function_descriptions">
<parameter key="Price to Stop" value="(Close-Stop)*eval(%{shares})"/>
<parameter key="Entry Cost" value="(Close)*eval(%{shares})"/>
<parameter key="Risk Pct" value="[Price to Stop] / [Entry Cost]"/>
<parameter key="Modified Signal" value="if(([Risk Pct]<0.1) && (Trend=="UP") && ([Trend-1]=="UP"),"BUY","SELL")"/>
</list>
</operator>
<operator activated="true" class="aggregate" compatibility="7.1.001" expanded="true" height="82" name="Aggregate" width="90" x="1519" y="34">
<list key="aggregation_attributes">
<parameter key="Rolling Cash" value="sum"/>
</list>
<parameter key="group_by_attributes" value="Trend"/>
</operator>
<operator activated="true" class="select_attributes" compatibility="7.1.001" expanded="true" height="82" name="Select Attributes" width="90" x="1653" y="340">
<parameter key="attribute_filter_type" value="subset"/>
<parameter key="attributes" value="Close|Date|Risk Pct|Signal|Stop|Trend|average(TR)|Modified Signal"/>
</operator>
<connect from_op="Yahoo Historical Stock Data" from_port="example set" to_op="Rename" to_port="example set input"/>
<connect from_op="Rename" from_port="example set output" to_op="Date to Numerical" to_port="example set input"/>
<connect from_op="Date to Numerical" from_port="example set output" to_op="Filter Examples" to_port="example set input"/>
<connect from_op="Filter Examples" from_port="example set output" to_op="Lag Series" to_port="example set input"/>
<connect from_op="Lag Series" from_port="example set output" to_op="Generate Attributes" to_port="example set input"/>
<connect from_op="Generate Attributes" from_port="example set output" to_op="Moving Average" to_port="example set input"/>
<connect from_op="Moving Average" from_port="example set output" to_op="Generate Attributes (2)" to_port="example set input"/>
<connect from_op="Generate Attributes (2)" from_port="example set output" to_op="Lag Series (2)" to_port="example set input"/>
<connect from_op="Lag Series (2)" from_port="example set output" to_op="Generate Attributes (3)" to_port="example set input"/>
<connect from_op="Generate Attributes (3)" from_port="example set output" to_op="Filter Example Range" to_port="example set input"/>
<connect from_op="Filter Example Range" from_port="example set output" to_op="Lag Series (3)" to_port="example set input"/>
<connect from_op="Lag Series (3)" from_port="example set output" to_op="Generate Attributes (4)" to_port="example set input"/>
<connect from_op="Generate Attributes (4)" from_port="example set output" to_op="Multiply" to_port="input"/>
<connect from_op="Multiply" from_port="output 1" to_op="Aggregate" to_port="example set input"/>
<connect from_op="Multiply" from_port="output 2" to_op="Generate Attributes (5)" to_port="example set input"/>
<connect from_op="Generate Attributes (5)" from_port="example set output" to_op="Select Attributes" to_port="example set input"/>
<connect from_op="Aggregate" from_port="example set output" to_port="result 1"/>
<connect from_op="Select Attributes" from_port="example set output" to_port="result 2"/>
<portSpacing port="source_input 1" spacing="0"/>
<portSpacing port="sink_result 1" spacing="0"/>
<portSpacing port="sink_result 2" spacing="0"/>
<portSpacing port="sink_result 3" spacing="0"/>
</process>
</operator>
</process>
Using Plotly and Python in RapidMiner
I’ve struggled for a while trying to build an embedded visualization for my auto-generated blog posts. I tried D3js (javascript), Bokeh (python), and Plot.ly (various languages) and got frustrated quickly for something that will allow me to easily create and auto embed a chart.
In general, D3js has no barriers for embedding but it’s a pain in the butt to code javascript for a non-coder like me. Bokeh uses python and is kinda of nice since I know python but it’s very hard to auto embed a visualization on the fly. Plus the generated visualization is 1,000’s of lines of autogenerated code and clipping and pasting the code into a markdown post is a no-no for me.
Next I investigated Plotly. While not 100% perfect, I liked it from the get go. It’s syntax is very easy to learn and you can code it using javascript, python, pandas, and R. Since I tend to avoid R, I tried coding in their javascript and python/pandas API. The same frustrations I had in coding D3js came back for their javascript API, so I focused completely on their python/pandas API.
That was a success. When I wrote out the python/pandas code and them embedded it my RapidMiner process (see below), I successfully generated a static PNG image from my RapidMiner process and auto embedded it into my markdown post.
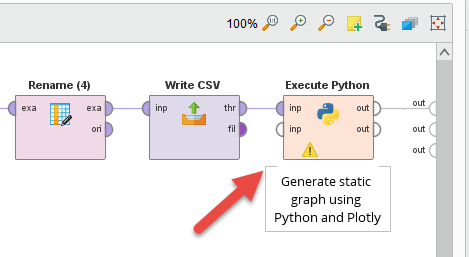
The only snag I ran into is that I needed to get an API token from Plot.ly to autogetnerate the static image. You can see in the code below that I “X’d” it out but it was pretty easy to get it once you create an account with Plot.ly.
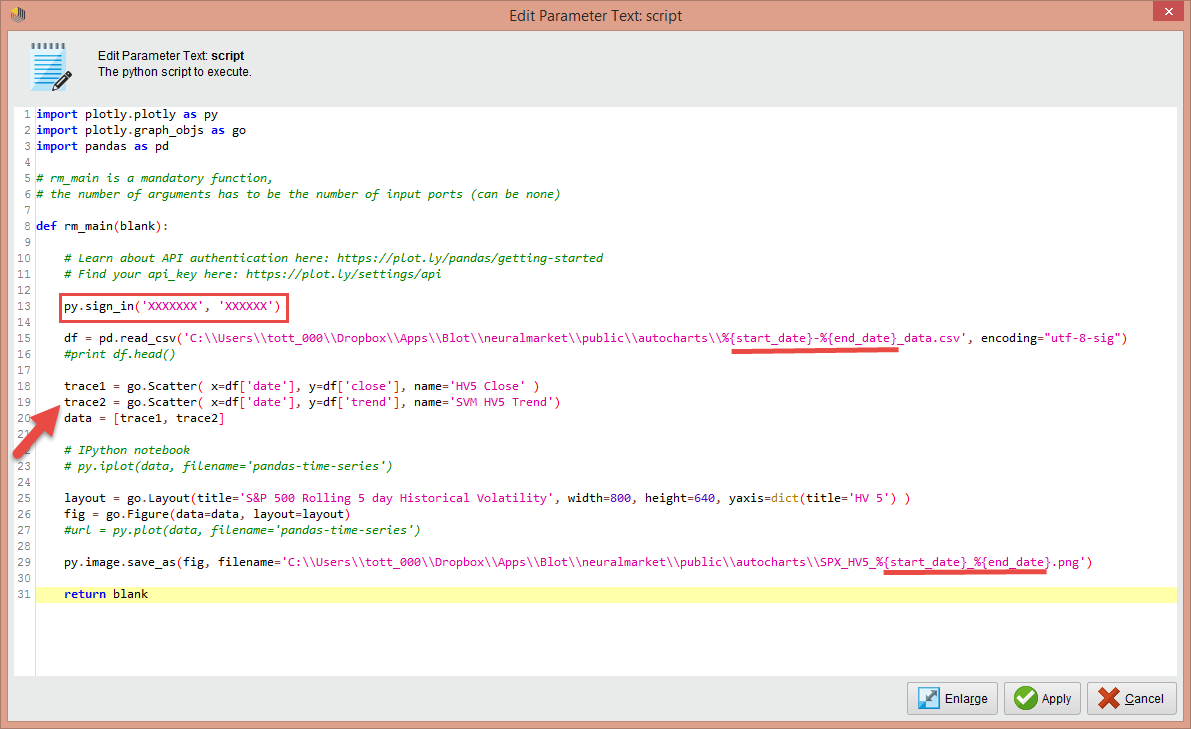
If you check out the python code I put into the RapidMiner Execute Python operator, you’ll notice that I use macros to alter the name of the autogenerated files. This is crucial if I want to “set it and forget it” autoposting in a production sense (like using the RapidMiner Server), but that’s a post for another day.
Here’s the python code in RapidMiner:
	import plotly.plotly as py
	import plotly.graph_objs as go
	import pandas as pd

	# rm_main is a mandatory function,
	# the number of arguments has to be the number of input ports (can be none)

	def rm_main(blank):

    	# Learn about API authentication here: https://plot.ly/pandas/getting-started
    	# Find your api_key here: https://plot.ly/settings/api

    	py.sign_in('XXXXX', 'XXXXX')

    	df = pd.read_csv('C:\\Users\\tott_000\\Dropbox\\Apps\\Blot\\neuralmarket\\public\\autocharts\\%{start_date}-%{end_date}_data.csv', encoding="utf-8-sig")
    	#print df.head()

    	trace1 = go.Scatter( x=df['date'], y=df['close'], name='HV5 Close' )
    	trace2 = go.Scatter( x=df['date'], y=df['trend'], name='SVM HV5 Trend')
    	data = [trace1, trace2]

    	# IPython notebook
    	# py.iplot(data, filename='pandas-time-series')

    	layout = go.Layout(title='S&P 500 Rolling 5 day Historical Volatility', width=800, height=640, yaxis=dict(title='HV 5') )
    	fig = go.Figure(data=data, layout=layout)
    	#url = py.plot(data, filename='pandas-time-series')

    	py.image.save_as(fig, filename='C:\\Users\\tott_000\\Dropbox\\Apps\\Blot\\neuralmarket\\public\\autocharts\\SPX_HV5_%{start_date}_%{end_date}.png')

    	return blank
Autogenerate Blog Posts with RapidMiner
Lately I’ve been fooling around with the new Blot.Im blogging engine and decided to see if I could use RapidMiner and some Javascript to auto generate a blog post with a stock chart. Since blot can parse txt, markdown, and HTML files, I decided to see if I can get this to work with an HTML. [While Markdown has the ability to parse HTML tags, it can’t parse Javascript correctly]1. After some pain, I got it to work with Blot, but you can extend this to any type of blogging system that parses HTML.
I designed a RapidMiner process that downloads the historical stock data using three macros: symbol, start_date, and end_date. These macros are help set the parameters in the Yahoo Stock Data operator but were also used to pass thru to the actual Javascript code.
For the stock chart I used the plot.ly library and passed the %{symbol} macro and %{end_date} to the script. For the sake of syncing up the saved CSV file, I had to careful that it was appended with those macros.
<?xml version="1.0" encoding="UTF-8" standalone="no"?>
<process version="7.0.001">
<context>
<input/>
<output/>
<macros>
<macro>
<key>symbol</key>
<value>VSLR</value>
</macro>
<macro>
<key>end_date</key>
<value>2016-04-14</value>
</macro>
<macro>
<key>start_date</key>
<value>2015-10-14</value>
</macro>
</macros>
</context>
<operator activated="true" class="process" compatibility="7.0.001" expanded="true" name="Process">
<process expanded="true">
<operator activated="true" class="quantx1:yahoo_historical_data_extractor" compatibility="1.0.006" expanded="true" height="82" name="Yahoo Historical Stock Data" width="90" x="45" y="34">
<parameter key="I agree to abide by Yahoo's Terms & Conditions on financial data usage" value="true"/>
<parameter key="Quick Stock Ticker Data" value="true"/>
<parameter key="Stock Ticker" value="%{symbol}"/>
<parameter key="select_fields" value="CLOSE|OPEN|DAY_LOW|DAY_HIGH"/>
<parameter key="date_format" value="yyyy-MM-dd"/>
<parameter key="date_start" value="%{start_date}"/>
<parameter key="date_end" value="%{end_date}"/>
</operator>
<operator activated="true" class="sort" compatibility="7.0.001" expanded="true" height="82" name="Sort" width="90" x="179" y="34">
<parameter key="attribute_name" value="Date"/>
</operator>
<operator activated="true" class="rename" compatibility="7.0.001" expanded="true" height="82" name="Rename" width="90" x="313" y="34">
<parameter key="old_name" value="%{symbol}_OPEN"/>
<parameter key="new_name" value="open"/>
<list key="rename_additional_attributes">
<parameter key="%{symbol}_DAY_HIGH" value="high"/>
<parameter key="%{symbol}_DAY_LOW" value="low"/>
<parameter key="%{symbol}_CLOSE" value="close"/>
<parameter key="Date" value="dates"/>
</list>
</operator>
<operator activated="true" class="select_attributes" compatibility="7.0.001" expanded="true" height="82" name="Select Attributes" width="90" x="447" y="34">
<parameter key="attribute_filter_type" value="single"/>
<parameter key="attribute" value="dates"/>
<parameter key="invert_selection" value="true"/>
</operator>
<operator activated="true" class="write_csv" compatibility="7.0.001" expanded="true" height="82" name="Write CSV" width="90" x="581" y="34">
<parameter key="csv_file" value="C:\Users\tott_000\Dropbox\Apps\Blot\neuralmarket\public\autocharts\%{symbol}_%{end_date}_data.csv"/>
<parameter key="column_separator" value=","/>
</operator>
<operator activated="true" class="text:create_document" compatibility="7.0.000" expanded="true" height="68" name="Plot.ly" width="90" x="45" y="187">
<parameter key="text" value="<head> <!-- Plotly.js --> <script src="https://cdn.plot.ly/plotly-latest.min.js"></script> <!-- PlotlyFinance.js --> <script src="https://cdn.rawgit.com/etpinard/plotlyjs-finance/master/plotlyjs-finance.js"></script> <body> <H1>Today's Chart: %{symbol}</h1> <p>The chart below is created using the Plot.ly JS library. This a daily chart starting from %{start_date} to %{end_date}.</p> <div id="myDiv" style="width: 100%; height: 380px;"><!-- Plotly chart will be drawn inside this DIV --></div> <script> 	function makeplot() { 	Plotly.d3.csv("https://www.neuralmarkettrends.com/_public/autocharts/%{symbol}_%{end_date}_data.csv", function(data){ processData(data) } ); 	}; 	function processData(allRows) { 	console.log(allRows); 	var data_open = [], data_close = [], data_high = [], data_low = [], dates = []; 	for (var i=0; i<allRows.length; i++) { 	 row = allRows[i]; data_close.push(parseFloat(row['close'])); data_high.push(parseFloat(row['high'])); data_low.push(parseFloat(row['low'])); data_open.push(parseFloat(row['open'])); 	 } 	 makePlotly( data_open, data_close, data_high, data_low ); 	} 	function makePlotly( data_open, data_close, data_high, data_low ){ 	 var data_dates = getAllDays('%{start_date}', '%{end_date}'); 	 var fig = PlotlyFinance.createCandlestick({ 	 open: data_open, 	 high: data_high, 	 low: data_low, 	 close: data_close, 	 dates: data_dates 	 }); 	fig.layout.title = 'Daily Stock Chart'; 	 fig.layout.annotations = [ 	 { 	 text: "%{symbol} Stock", 	 x: '-0.05', 	 y: 0.5, 	 xref: 'paper', 	 yref: 'paper', 	 font:{ 	 size: 18 	 }, 	 showarrow: false, 	 xanchor: 'right', 	 textangle: 270 	 } 	 ]; 	Plotly.newPlot('myDiv', fig.data, fig.layout); 	}; // Utility Function to generate all days function getAllDays(start, end) { var s = new Date(start); var e = new Date(end); var a = []; while(s < e) { a.push(s); s = new Date(s.setDate( s.getDate() + 1 )) } return a; }; makeplot(); </script> </body> "/>
</operator>
<operator activated="true" class="text:write_document" compatibility="7.0.000" expanded="true" height="82" name="Convert format" width="90" x="179" y="187"/>
<operator activated="true" class="write_file" compatibility="7.0.001" expanded="true" height="68" name="Write to HTML format (3)" width="90" x="313" y="187">
<parameter key="filename" value="C:\Users\tott_000\Dropbox\Apps\Blot\neuralmarket\2016\%{end_date}-%{symbol}-chart.html"/>
</operator>
<connect from_op="Yahoo Historical Stock Data" from_port="example set" to_op="Sort" to_port="example set input"/>
<connect from_op="Sort" from_port="example set output" to_op="Rename" to_port="example set input"/>
<connect from_op="Rename" from_port="example set output" to_op="Select Attributes" to_port="example set input"/>
<connect from_op="Select Attributes" from_port="example set output" to_op="Write CSV" to_port="input"/>
<connect from_op="Plot.ly" from_port="output" to_op="Convert format" to_port="document"/>
<connect from_op="Convert format" from_port="file" to_op="Write to HTML format (3)" to_port="file"/>
<portSpacing port="source_input 1" spacing="0"/>
<portSpacing port="sink_result 1" spacing="0"/>
</process>
</operator>
</process>
While this works really great, it does have one snag. If you want to display multiple stockcharts, you’d have to figure out a way to update the location of the chart relative to where your blog post is.
This is important if you show more than one post per page. When I generated two posts with two different stockcharts, the HTML made them relative to the top of the page. In other words, the one chart was on top of the other one. I’m sure this is an easy fix but something I’m not going to bother with for this tutorial!
Using D3js in RapidMiner
Just a quick post. I’m experimenting with adding a D3js type of dashboard to this site. I wrote a simple process to pull the closing prices of the S&P500 in RapidMiner Studio and saved a CSV file to my Dropbox. From there it uploads it to the S3 folders and renders a nice chart, using a sample javascript from Techan.js. The chart uses both the Techan.js and D3js libraries which provides for a pretty interface and cool chart. Try zooming and panning around, it’s slick!
I originally wrote a small Pandas python script to do the index price scrapping but it mangles the data-time format, even when I set the format_format=%Y-%m-%d. The RapidMiner process makes it super simple to modify the data-time format, so it can work with D3, but I need to investigate this further.
Below is the RapidMiner process that pulls the Yahoo data, formats it, and writes to a CSV.
<?xml version="1.0" encoding="UTF-8" standalone="no"?>
<process version="7.0.001">
<context>
<input/>
<output/>
<macros>
<macro>
<key>symbol</key>
<value>^GSPC</value>
</macro>
</macros>
</context>
<operator activated="true" class="process" compatibility="7.0.001" expanded="true" name="Process">
<process expanded="true">
<operator activated="true" class="quantx1:yahoo_historical_data_extractor" compatibility="1.0.006" expanded="true" height="82" name="Yahoo Historical Stock Data" width="90" x="45" y="34">
<parameter key="I agree to abide by Yahoo's Terms & Conditions on financial data usage" value="true"/>
<parameter key="Quick Stock Ticker Data" value="true"/>
<parameter key="Stock Ticker" value="%{symbol}"/>
<parameter key="select_fields" value="CLOSE|VOLUME|OPEN|DAY_LOW|DAY_HIGH"/>
<parameter key="date_format" value="yyyy-MM-dd"/>
<parameter key="date_start" value="2015-01-01"/>
<parameter key="date_end" value="2016-02-15"/>
</operator>
<operator activated="true" class="date_to_nominal" compatibility="7.0.001" expanded="true" height="82" name="Date to Nominal" width="90" x="179" y="34">
<parameter key="attribute_name" value="Date"/>
<parameter key="date_format" value="dd-MMM-yy"/>
</operator>
<operator activated="true" class="rename" compatibility="7.0.001" expanded="true" height="82" name="Rename" width="90" x="313" y="34">
<parameter key="old_name" value="%{symbol}_OPEN"/>
<parameter key="new_name" value="Open"/>
<list key="rename_additional_attributes">
<parameter key="%{symbol}_DAY_HIGH" value="High"/>
<parameter key="%{symbol}_DAY_LOW" value="Low"/>
<parameter key="%{symbol}_CLOSE" value="Close"/>
<parameter key="%{symbol}_VOLUME" value="Volume"/>
</list>
</operator>
<operator activated="true" class="sort" compatibility="7.0.001" expanded="true" height="82" name="Sort" width="90" x="447" y="34">
<parameter key="attribute_name" value="Date"/>
<parameter key="sorting_direction" value="decreasing"/>
</operator>
<operator activated="true" class="write_csv" compatibility="7.0.001" expanded="true" height="82" name="Write CSV" width="90" x="648" y="34">
<parameter key="csv_file" value="C:\Users\tott_000\Dropbox\neuralmarkettrends.com\d3\SP500\data.csv"/>
<parameter key="column_separator" value=","/>
</operator>
<connect from_op="Yahoo Historical Stock Data" from_port="example set" to_op="Date to Nominal" to_port="example set input"/>
<connect from_op="Date to Nominal" from_port="example set output" to_op="Rename" to_port="example set input"/>
<connect from_op="Rename" from_port="example set output" to_op="Sort" to_port="example set input"/>
<connect from_op="Sort" from_port="example set output" to_op="Write CSV" to_port="input"/>
<connect from_op="Write CSV" from_port="through" to_port="result 1"/>
<portSpacing port="source_input 1" spacing="0"/>
<portSpacing port="sink_result 1" spacing="0"/>
<portSpacing port="sink_result 2" spacing="0"/>
</process>
</operator>
</process>
D3js Scatterplots in RapidMiner
Continuing on the theme of using D3js to visualize RapidMiner results, this time I show you how to skip putting it into a RapidMiner Server dashboard. I simply borrowed the scatterplot D3js code from mblocks and slapped into a RapidMiner process (see XML below).
For this example, I’m just using the Iris data set but I have tried it with shapefiles and other data. I also use RapidMiner macros to vary the x and y axis. You can control those macros within the context view of RapidMiner.
When you execute the process, it writes two files to a tmp directory, the Iris data set in a data.js file and the actual scatterplot HTML file. The data.js file is called into the HTML file.
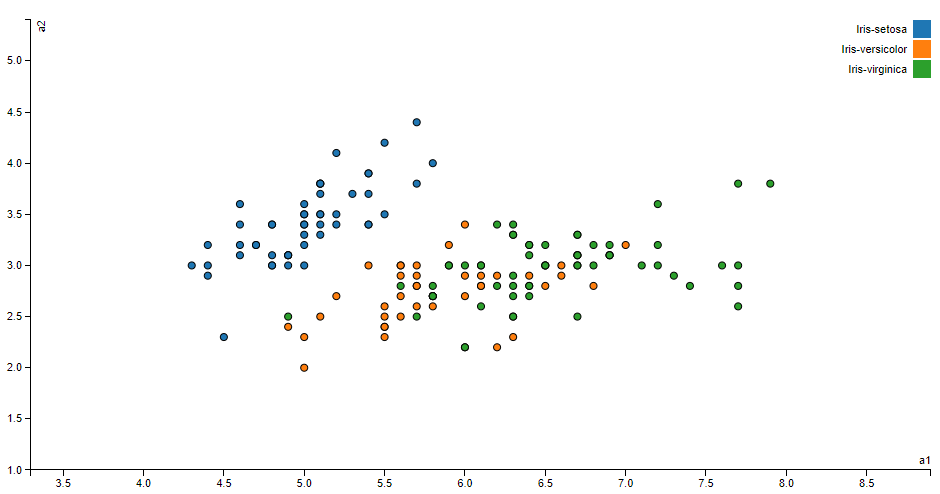
Note: you will need some sort of web server to be running so you can render the generated HTML file correcly. Enjoy!
<?xml version="1.0" encoding="UTF-8" standalone="no"?>
<process version="6.5.002">
<context>
<input/>
<output/>
<macros>
<macro>
<key>x_axis</key>
<value>a2</value>
</macro>
<macro>
<key>y_axis</key>
<value>a3</value>
</macro>
<macro>
<key>color_column</key>
<value>label</value>
</macro>
</macros>
</context>
<operator activated="true" class="process" compatibility="6.5.002" expanded="true" name="Process">
<process expanded="true">
<operator activated="true" class="text:create_document" compatibility="6.5.000" expanded="true" height="60" name="Create Document (3)" width="90" x="45" y="255">
<parameter key="text" value="<!DOCTYPE html> <html> <meta charset="utf-8"> <!-- Example based on https://bl.ocks.org/mbostock/3887118 --> <!-- Tooltip example from https://www.d3noob.org/2013/01/adding-tooltips-to-d3js-graph.html --> <style> body { font: 11px sans-serif; } .axis path, .axis line { fill: none; stroke: #000; shape-rendering: crispEdges; } .dot { stroke: #000; } .tooltip { position: absolute; width: 200px; height: 28px; pointer-events: none; } </style> <body> <script src="https://d3js.org/d3.v3.min.js"></script> <script> var margin = {top: 20, right: 20, bottom: 30, left: 40}, width = 960 - margin.left - margin.right, height = 500 - margin.top - margin.bottom; /* * value accessor - returns the value to encode for a given data object. * scale - maps value to a visual display encoding, such as a pixel position. * map function - maps from data value to display value * axis - sets up axis */ // setup x var xValue = function(d) { return d.%{x_axis};}, // data -> value xScale = d3.scale.linear().range([0, width]), // value -> display xMap = function(d) { return xScale(xValue(d));}, // data -> display xAxis = d3.svg.axis().scale(xScale).orient("bottom"); // setup y var yValue = function(d) { return d.%{y_axis};}, // data -> value yScale = d3.scale.linear().range([height, 0]), // value -> display yMap = function(d) { return yScale(yValue(d));}, // data -> display yAxis = d3.svg.axis().scale(yScale).orient("left"); // setup fill color var cValue = function(d) { return d.%{color_column};}, color = d3.scale.category10(); // add the graph canvas to the body of the webpage var svg = d3.select("body").append("svg") .attr("width", width + margin.left + margin.right) .attr("height", height + margin.top + margin.bottom) .append("g") .attr("transform", "translate(" + margin.left + "," + margin.top + ")"); // add the tooltip area to the webpage var tooltip = d3.select("body").append("div") .attr("class", "tooltip") .style("opacity", 0); // load data d3.json("data.js", function(error, data) { // change string (from CSV) into number format data.forEach(function(d) { d.%{x_axis} = +d.%{x_axis}; d.%{y_axis} = +d.%{y_axis}; // console.log(d); }); // don't want dots overlapping axis, so add in buffer to data domain xScale.domain([d3.min(data, xValue)-1, d3.max(data, xValue)+1]); yScale.domain([d3.min(data, yValue)-1, d3.max(data, yValue)+1]); // x-axis svg.append("g") .attr("class", "x axis") .attr("transform", "translate(0," + height + ")") .call(xAxis) .append("text") .attr("class", "label") .attr("x", width) .attr("y", -6) .style("text-anchor", "end") .text("%{x_axis}"); // y-axis svg.append("g") .attr("class", "y axis") .call(yAxis) .append("text") .attr("class", "label") .attr("transform", "rotate(-90)") .attr("y", 6) .attr("dy", ".71em") .style("text-anchor", "end") .text("%{y_axis}"); // draw dots svg.selectAll(".dot") .data(data) .enter().append("circle") .attr("class", "dot") .attr("r", 3.5) .attr("cx", xMap) .attr("cy", yMap) .style("fill", function(d) { return color(cValue(d));}) .on("mouseover", function(d) { tooltip.transition() .duration(200) .style("opacity", .9); tooltip.html(d["%{color_column}"] + "<br/> (" + xValue(d) 	 + ", " + yValue(d) + ")") .style("left", (d3.event.pageX + 5) + "px") .style("top", (d3.event.pageY - 28) + "px"); }) .on("mouseout", function(d) { tooltip.transition() .duration(500) .style("opacity", 0); }); // draw legend var legend = svg.selectAll(".legend") .data(color.domain()) .enter().append("g") .attr("class", "legend") .attr("transform", function(d, i) { return "translate(0," + i * 20 + ")"; }); // draw legend colored rectangles legend.append("rect") .attr("x", width - 18) .attr("width", 18) .attr("height", 18) .style("fill", color); // draw legend text legend.append("text") .attr("x", width - 24) .attr("y", 9) .attr("dy", ".35em") .style("text-anchor", "end") .text(function(d) { return d;}) }); </script> </body> </html>"/>
<description align="center" color="transparent" colored="false" width="126">D3js Scatterplot script</description>
</operator>
<operator activated="true" class="text:write_document" compatibility="6.5.000" expanded="true" height="76" name="Write Document" width="90" x="179" y="255"/>
<operator activated="true" class="write_file" compatibility="6.5.002" expanded="true" height="60" name="Write File" width="90" x="313" y="255">
<parameter key="filename" value="C:\tmp\D3\IRISscatterplot.html"/>
<description align="center" color="transparent" colored="false" width="126">Write HTML with D3js</description>
</operator>
<operator activated="true" class="retrieve" compatibility="6.5.002" expanded="true" height="60" name="Retrieve Iris" width="90" x="45" y="30">
<parameter key="repository_entry" value="//Samples/data/Iris"/>
<description align="center" color="transparent" colored="false" width="126">Load Iris Data</description>
</operator>
<operator activated="true" class="text:data_to_json" compatibility="6.5.000" expanded="true" height="76" name="Data To JSON" width="90" x="179" y="30">
<parameter key="generate_array" value="true"/>
<description align="center" color="transparent" colored="false" width="126">Convert to JSON</description>
</operator>
<operator activated="true" class="text:write_document" compatibility="6.5.000" expanded="true" height="76" name="Write Document (2)" width="90" x="313" y="30">
<description align="center" color="transparent" colored="false" width="126">Write JSON data for D3plt</description>
</operator>
<operator activated="true" class="write_file" compatibility="6.5.002" expanded="true" height="60" name="Write File (2)" width="90" x="581" y="120">
<parameter key="filename" value="C:\tmp\D3\data.js"/>
<description align="center" color="transparent" colored="false" width="126">JS data file</description>
</operator>
<operator activated="true" class="text:documents_to_data" compatibility="6.5.000" expanded="true" height="76" name="Documents to Data" width="90" x="581" y="30">
<parameter key="text_attribute" value="text"/>
</operator>
<operator activated="true" class="extract_macro" compatibility="6.5.002" expanded="true" height="60" name="Extract Macro" width="90" x="715" y="30">
<parameter key="macro" value="jsonData"/>
<parameter key="macro_type" value="data_value"/>
<parameter key="attribute_name" value="text"/>
<parameter key="example_index" value="1"/>
<list key="additional_macros"/>
</operator>
<connect from_op="Create Document (3)" from_port="output" to_op="Write Document" to_port="document"/>
<connect from_op="Write Document" from_port="file" to_op="Write File" to_port="file"/>
<connect from_op="Write File" from_port="file" to_port="result 1"/>
<connect from_op="Retrieve Iris" from_port="output" to_op="Data To JSON" to_port="example set 1"/>
<connect from_op="Data To JSON" from_port="documents" to_op="Write Document (2)" to_port="document"/>
<connect from_op="Write Document (2)" from_port="document" to_op="Documents to Data" to_port="documents 1"/>
<connect from_op="Write Document (2)" from_port="file" to_op="Write File (2)" to_port="file"/>
<connect from_op="Documents to Data" from_port="example set" to_op="Extract Macro" to_port="example set"/>
<portSpacing port="source_input 1" spacing="0"/>
<portSpacing port="sink_result 1" spacing="0"/>
<portSpacing port="sink_result 2" spacing="0"/>
</process>
</operator>
</process>
-
Nope, got it to work in Markdown with the help of https://twitter.com/lllIIlIlIl ↩︎