30 Year Mortgage Rates Almost at 8%
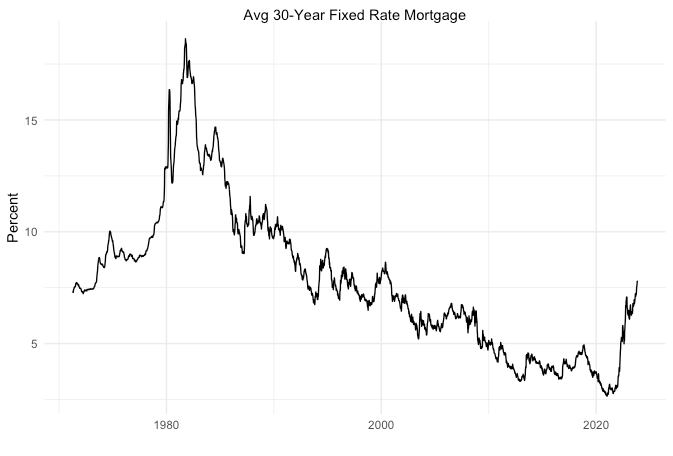
Economy Tutorials R CodeI’ve been closely tracking data from the St. Louis Federal Reserve for the past few years, and I’m fascinated by the way the data they collect can paint a picture. Sometimes, when you focus on a very short time period, it can be confusing, but if you take a step back and look at the bigger picture, things become much clearer. Currently, the 30-year fixed mortgage rates are on the rise, approaching 8%.
This increase in mortgage rates has caused a lot of concern in the real estate market and is beginning to put downward pressure on residential property prices. However, this situation is not entirely new. As the saying goes, history doesn’t repeat itself, but it often rhymes, and this is a prime example. Mortgage rates are approaching levels last seen in August 2000, but home prices are still at very high levels.
The Federal Reserve has been working diligently to control monetary policy, especially after the massive injection of funds into the market following the 2007/2008 financial crisis. It seems like their plan is working. Jerome Powell, the current Fed chair, is making moves that could potentially impact the real estate market. He may unintentionally contribute to a real estate market downturn before eventually stepping in and lowering interest rates.
I guess that he is closely monitoring the yield curve, particularly the 2-year and 10-year Treasury bill ratio, which remains inverted. This inversion typically signals a future recession, though the exact timing is uncertain. As long as the financial markets continue to respond positively to the Federal Reserve’s apparent halt in raising interest rates, the economy may continue to grow, potentially delaying the onset of a recession.
However, when that recession eventually arrives and both the commercial and residential real estate markets start to crumble, Powell may step in and reduce interest rates to help stabilize the situation.
30-Year Fixed Mortgage R Code
I’ve been playing around with R lately as a way to make cool infographics. Right now I’m making simple time series graphs. Here’s the code I used to build the graph above. The CSV file is below.
library(readr)
library(ggplot2)

data <- read_csv("Documents/GitHub/RCode/TS/30yrmortgage/MORTGAGE30US.csv")

p <- ggplot(data, aes(x=DATE, y=MORTGAGE30US)) +
  geom_line(color="black") +
  theme_minimal() +
  labs(x="", y="Percent", title="Avg 30-Year Fixed Rate Mortgage") +
  theme(plot.title = element_text(hjust=0.5, size=20, face="bold") +
        annotate("text", x=10, y=1, label= "(c) neuralmarkettrends.com") )

p