Guide to AI Transformation
AI Machine LearningThirteen years ago I made a simple post about building neural net models. Since then, the field of applied machine learning and data science has changed a great deal. Over a single decade new tools and the open source movement have altered how companies do ‘AI.’ They moved from data mining data in databases to building data lakes and clusters. Now, small to large companies are seeking ways to harness these tools under the umbrella of ‘AI.’
The term ‘AI’ is such a charged term. It means so many different things to a practitioner or a business manager. What AI means to a mid level manager is different than what it means to an upper level manager. Upper level management sees AI as a strategic way to transform the organization. Mid level managers see it as a way to meet their task objectives.
When I first wrote this article, I referenced nine (9) general steps in a process of data mining. The application of these 9 steps are still valuable today when taken in context of the CRISP-DM cycle.
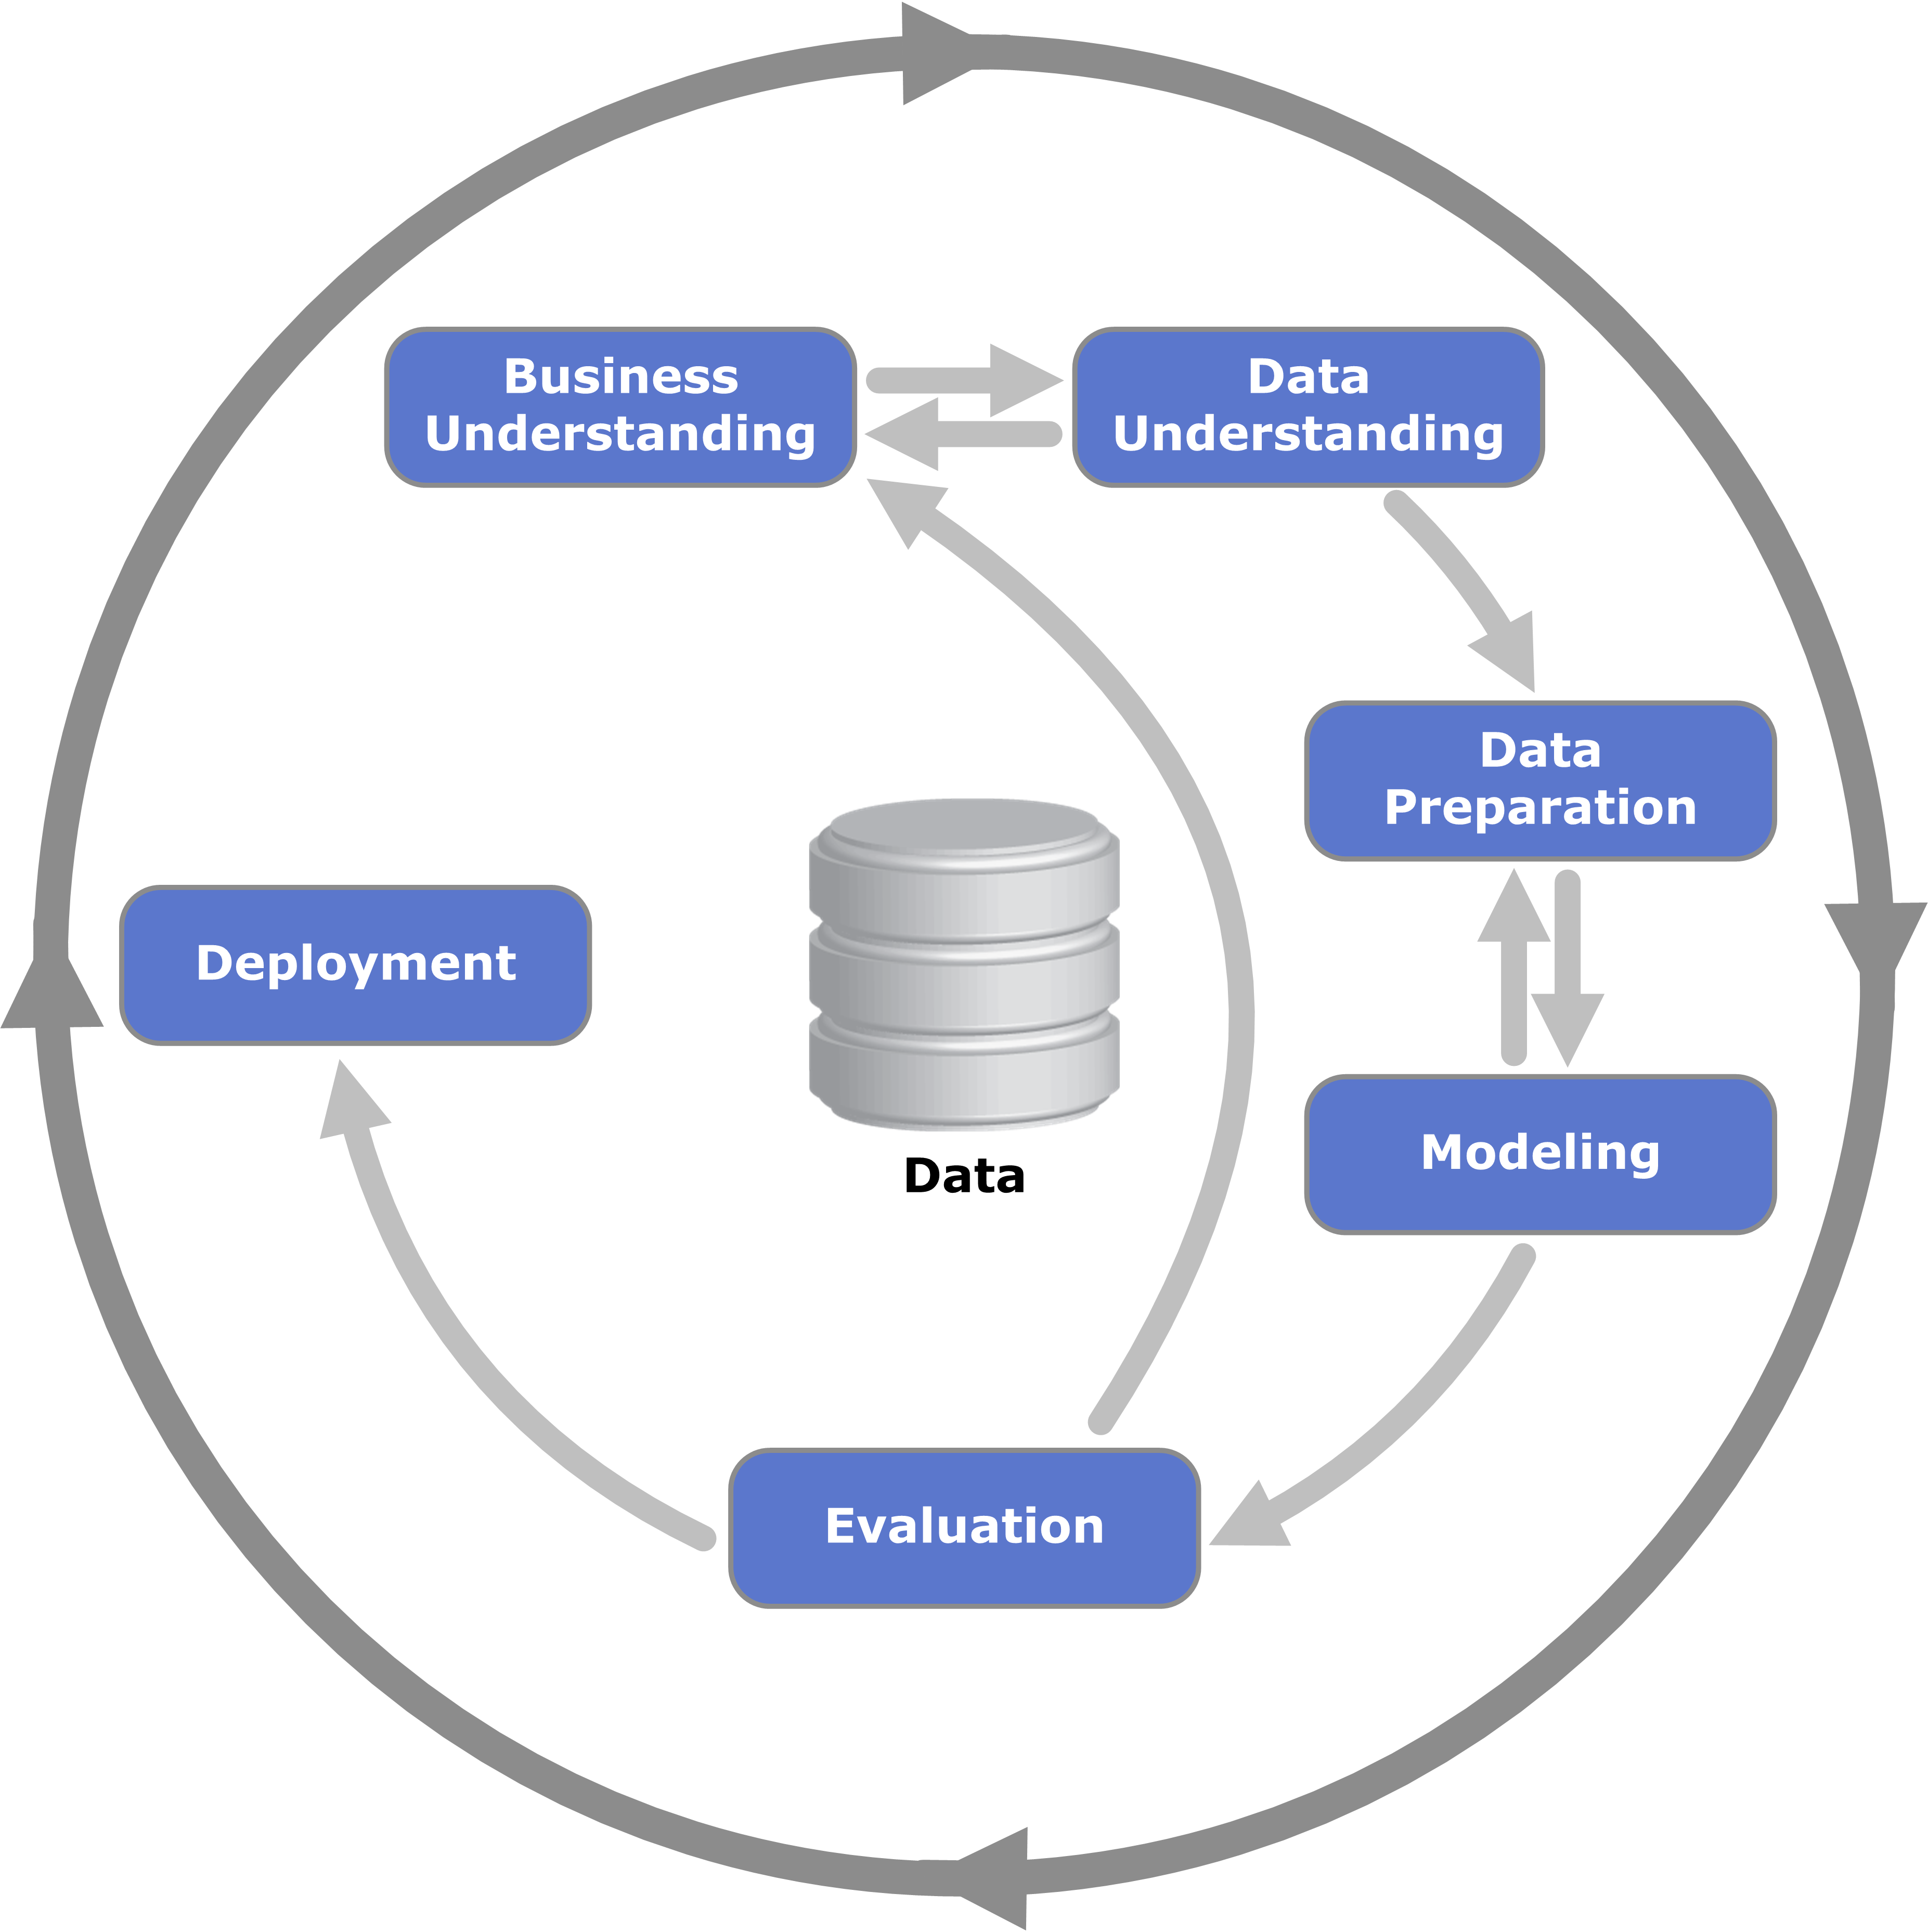
CRISP-DM is a standard method for end to end model building, tuning, and deployment. Although the method needs business input, it’s sole focus is technical in nature. It’s relegated to the execution of a desired business need, not the actual impetus for that need. This is an important distinction to understand because business need drives AI adoption. Not the other way around. AI is nothing more than a set of tools that can ‘get you where you’re going.’
Transforming a company into an AI company is a hard task. It requires a deep understanding of its IT infrastructure, talent, and culture. Along with upper level management, understanding these key peices can effecuate AI transformation.
It’s no easy task to do this, especially if your organization is averse to change. So, how does one transform an organization into an AI driven organization? The simple answer, help them ‘connect the dots.’ The harder answer? A strategic multi-prong approach to changing the culture, IT infrastructure, and hiring talent.
The 2007 post
The 9 steps to AI model building were first published by my old college professor, Dr. Stephan Kudyba. His book, “Data Mining and Business Intelligence” was my foundation for model building.
In the early days, his model building was using a generic back propagation neural net. They work well on some use cases but not every one. This is what we call the ‘no free lunch’ theorem. Some algorithms work better on some datasets and one size algorithm does not fit all.
The 2020 Post
In reality, organizations go through many starts and stops as they begin to transform. The process is fraught with stumbles and general frustration as the field of AI in itself is complex. I highlight these pitfalls in my most recent talk titled “Real AI Transformation.”
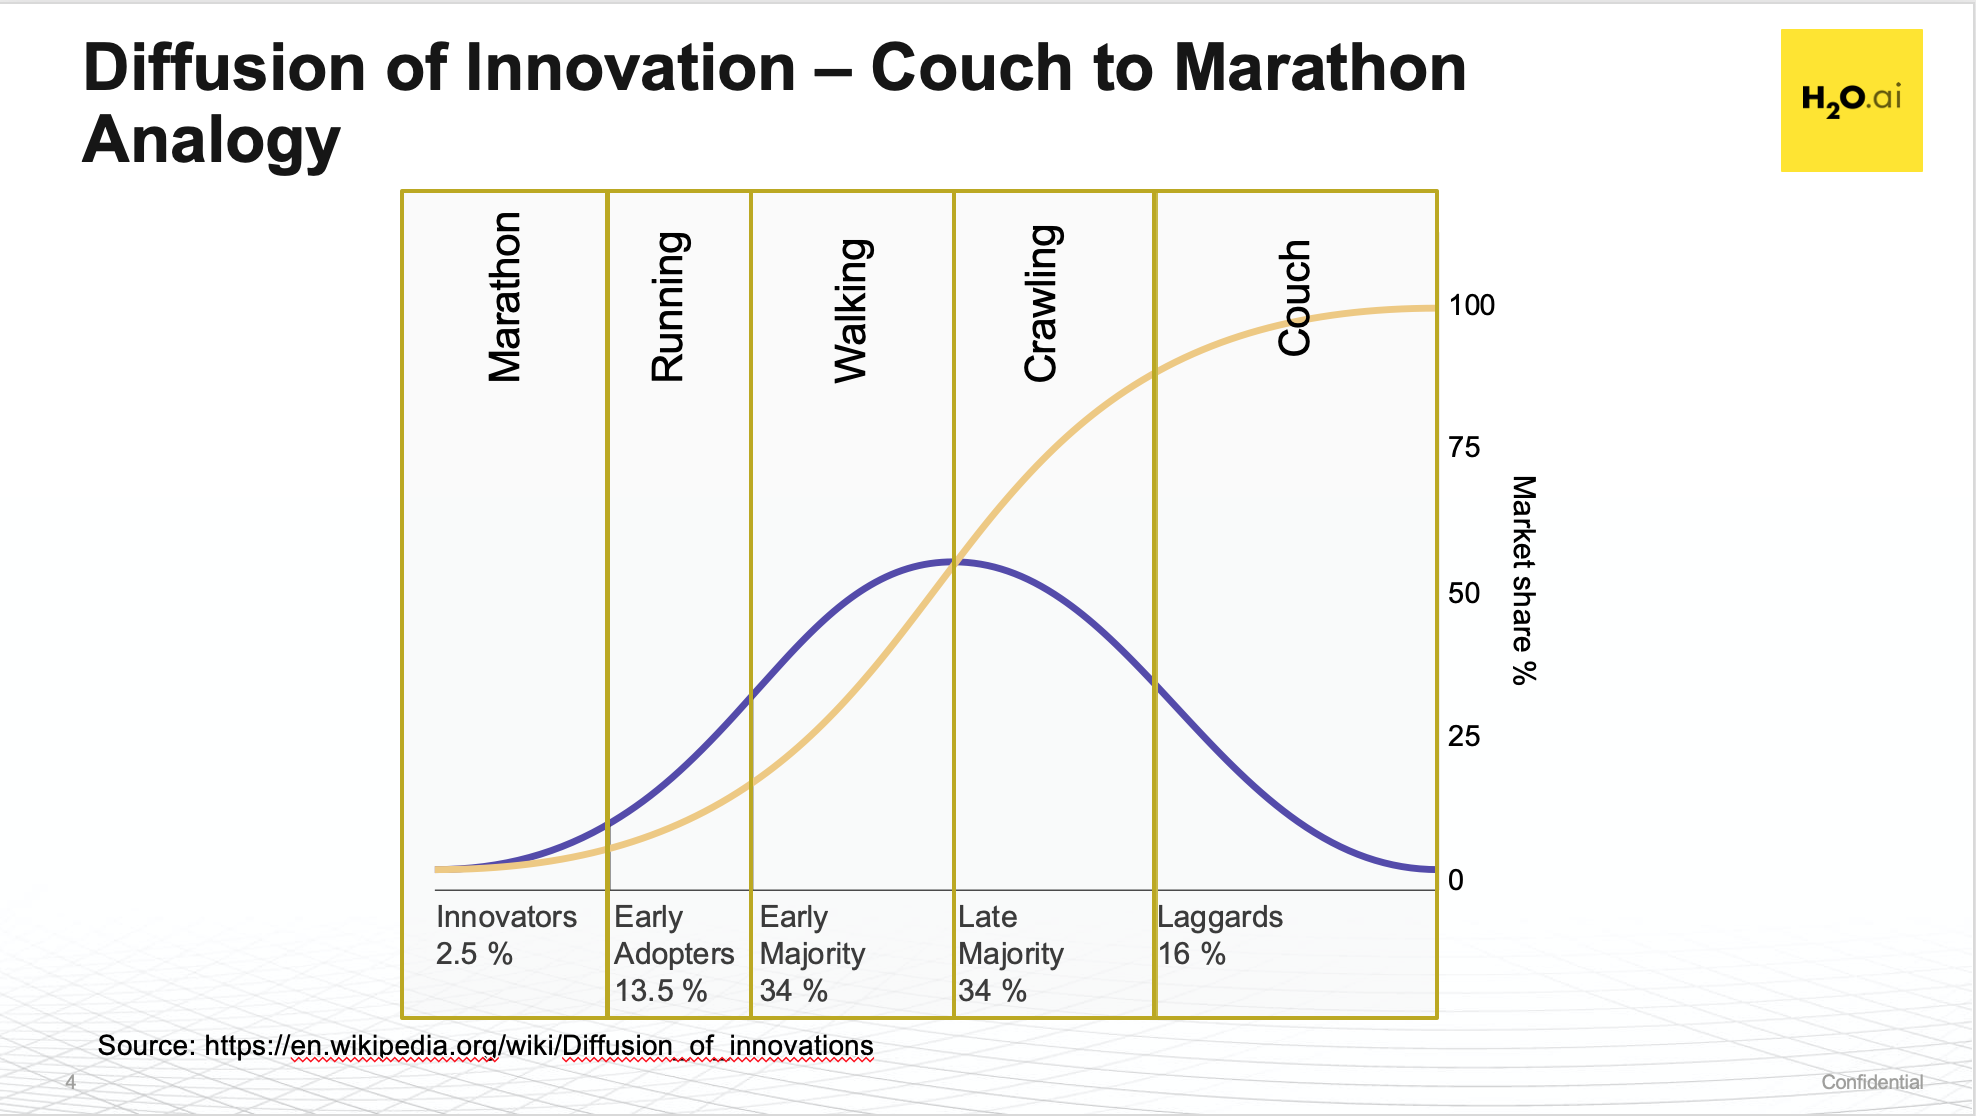
The best way to understand where an organization is on their transformation journey, is to use the Diffusion of Innovation curve. Further, simplifying it into a Couch, Crawl, Walk, Run, Marathon analogy works well here. Every organization wants ‘Run’ but often finds themselves ‘Crawling.’
Guide to AI Transformation
Writing any type of guide is exactly what it is, a guide. It is not a specific execution plan or deep analysis of your organization. It’s meant to be a general framework to which one can evaluate their organization. It’s advised to bring an experienced consultant onboard to effecuate these changes if an organization is serious about its AI Transformation goals.
Couch, Crawl, Walk, Run, Marathon
The best analogy I’ve found is to use the Couch, Crawl, Walk, Run, Marathon analogy. I’ve also found that many organizations often believe they’re one or two levels higher than where they really are. In some cases, organizations that classify themslves are ‘Walking’ are really on the ‘Couch.’ The common misconception here is that AI Transformation is soley a technical thing and relegated to the IT side of the organization.
IT Infrastructure
Every modern organization, whether small or large, has some sort of IT infrastructure. We send emails, write reports, and capture data every day. Data points will different from organization to organization. Yet how the data applied will be the same. For refernce, see the CRISP-DM cycle above.
Data scientists or machine learning engineers will shape the data in ways for algorithms to consume. The evaluation of the model building results will determine if the model meets the business goals. If it doesn’t then it will continue along the CRISP-DM cycle above.
Broken into 9 smaller steps for only the data understanding to evaluation phase are:
Step 1: Decide what you want to know
This is tougher than it seems. First you’ll say, oh I want to know what drives my sales but when you dig deeper you might want to know what drives sales based on your marketing campaigns. Take the time to ask questions and think about what you want to discover before you spend the time building the model!
This is the hardest thing I deal with day in and day out. It always starts as “We want to increase sales by using AI” or “We want to cut our costs using AI.” Those goals are very nebulous and can mean anything, especially how the AI buzz word is thrown around. I’ll give you an example.
Right before Covid19 hit, I was invited to speak at an automation conference that invited a lot of AI-related companies. The general term of AI encompasses so many different facets of Data Science and Machine Learning that may people get confused about what it can do for them. I sat and met with many people to listened to their problems and where they think ‘AI’ can help them. It turns out that 9 times out of 10 their problem was that the data they needed to model was siloed in different systems and there was no cohesive Master Data Management (MDM) system. They couldn’t deliver on “increasing sales or cutting costs with AI” because they couldn’t even load and use their data!
For the 1 out 10 that had data to model, they thought that they could flip a switch and “increase their sales or cut costs with AI.” The didn’t give any deeper thought to all the moving parts for building a robust model, so I had to ask and help them rephrase the question.
This is what I do a lot in my day to day job, help rephrase the question from business speak to technical speak. For example, “increasing sales with AI” broke down to nothing more than a lead scoring model. They wanted to know how to better score incoming leads so that their salespeople would spend time on the right leads to call. This clarification turned into a simple binary classification problem with an evaluation of the F1 and AUC scores (more on this below).
Step 2: Select the Relevant Performance Measure
After you decided what you want to find out from your data, you have to identify the relevant performance measure. This means what kind of metric you want to achieve for your output. Are you looking for a simple answer, such as is the trend UP or DOWN? Or do you want to know the age group of teenagers who buy a particular brand of your soap?
For the lead scoring example above, once I realized what they were trying to do, the next step was to figure out what performance metric to use. Usually, the default performance metric is AUC for binary class problems and you want to optimize your models for that. In some cases, you might want to consider logloss (to make sure the classes are distinct) or F1 (reduce the false positives).
A lot of times you will train the model and optimize on different performance measures so you can evaluate the ’trade-offs’ between the models. This makes sense because you can help the business stakeholder decide what model is best for production. Do they care about getting the best prediction for the binary class or do they care more about not giving their salespeople a shortlist of leads with false positives in them?
Step 3: Decide what Instance the Data will be
Next, you have to inspect the data you have at hand and decide the time frame you wish your results to be in. Do you want to know the monthly, weekly, or daily trends of your stock market models or quarterly results from your market campaign?
This part is the beginning of the data evaluation step(s) and these steps to be out of order or at least redundant now when compared to real-world application. You start with data ingestion and then you inspect the data. This is a lengthy step when compared to model training and scoring but it’s one of the most important steps you should take. This is where you look at correlations, visualizing the data, finding outliers, etc. If you’re using R or Python, you can always grab open source packages like Seaborn, GGPlot, and others too visualize your data.
In this step, you should be thinking about how to build new features or if you need to aggregate your data. This is especially important for time series data. Do you have daily data but need to make weekly forecasts? If yes, how do you aggregate your daily data? Do you use the Max, Min, or Mean values in the aggregation? So thinking of the what ‘instance your data is in’ is one part of it.
For the modern data scientist or machine learning expert, the steps should be reorganized this way, so keep this in mind as you read on.
- Frame the right question (step 1)
- Select the best performance measure (step 2)
- Acquire the data and what instance it’s in (step 5 & step 3)
- Identify your target variable (step 4)
- Visually inspect the data (step 6)
- Transform and Feature Engineering (step 7)
- Model training (step 8)
- Review the results (step 9)
Step 4: Identify your Driving Variables
Once you have your data and it’s in the right format you want, you have to determine which variables are the likely drivers that explain what’s causing your events to occur. We discussed driving/input variables at length in Lesson I of Building an AI financial data model.
This is your target variable. In the case of the lead scoring example, it was ‘converted.’ Now, this sounds pretty simple, you look at your data and say this is the column I want to predict or know when scoring in the future. That’s generally simple BUT this is where you need to review the data and even visualize it.
There’s this thing call target leaks where you leak data into the model building process that ‘games’ the system. When you start model building you end up getting awesome results. Like 99% accuracy or an AUC of .98 right out of the gate. I’d be skeptical about these results and would look for columns in the data set that ‘mirror’ what the target variable is. Visualizing the data or using correlation matrixes is also a handy way to identify these potential leaks too.
Step 5: Acquire the Data
After you’ve done all that, you can build your data warehouse. Now download and compile all your data into a spreadsheet or database. See how much thought goes into this if you want to do it right?
Ok this is pretty simple, get your data first and start looking at.
Step 6: Visually Inspect the Data
This is where you look for holes in your data. Often I’ve seen missing bits of data or corrupted data such as integers in a categorical columns. This gets tedious if its volumes of data but t must be done. Tip: YALE alerts you if you have missing data!
No one uses YALE anymore because it doesn’t exist, it was cannibalized by RapidMiner Studio. Should you use RapidMiner Studio? You could but, and I hate to say it, I wouldn’t recommend using them. I’m not a fan of how they decided to cripple the rows for their ‘free version’. It’s better to use R or Python and load in all your data. Your only constraints would be your hardware and it’s pretty easy to spin up a Jupyter Notebook on AWS and swap out the instance size if you need more power to build your model.
Step 7: Transform the Data
Sometimes the raw data you have may not be presented in the best way for you to mine it and you may have to add additional calculations (standard deviations or % returns) to it. In other instances you identify the strange data spikes, called outliers, in the data sets (you should delete these).
Transforming your Data is an important step. This is where I manage outliers, replace missing values, and build new features. This step is crucial because it’s the difference between ‘ho-hum’ performance or stellar performance. One day in the future I’ll write a long post about feature engineering and why it’s so important. If readers are interested, I made a presentation on how Driverless AI’s Feature Engineering squeezed out more model performance over the same model in H2O-3 open source.
Step 8: Mine the Data
No one says ‘mine the data’ anymore. No one uses the term ‘Data Mining’ anymore either. It’s simple ’train the model’ or ‘model training’. Still, I want to point out that the model training methodologies are very important. There are big differences in performance between a simple Split Validation and Cross Fold Validation. So the way you set up your model training experiment will matter as well.
The one topic I’m not going to get into here is how to do handle imbalanced datasets. For the lead scoring example, a converted lead is a fraction of the overall data set. There are more ’no conversions’ then ‘converted’ and this target imbalance can cause the model training performance to be skewed. There are methods on how to handle this imbalance (up or downsampling) but the question is where do you do your data balancing? Before the model training or during the model training? This is something to think about before you ‘mine the data.’
Step 9: Inspect Your Results
Does the data mining output make sense? Did it meet your assumptions or did it give you something different. You should always review and analyze your results because you never know if you made a big blunder or the discovery of the century!
There you have it folks, datamining and the building of a neural net/AI model in 9 easy steps!
Inspecting your results and the general performance of the model is important. It will help you decide if there is a ‘signal’ in the noise of your dataset. It will help you figure out if you need more data or not. It will make you wonder if you should do hyperparameter tuning or not (you do this anyway).
At this stage, you might consider trying a different algorithm too. The modern gradient boosting tree algorithms are generally good to try out and give you good performance. Of course, random forests and even deep learning neural nets work well too for specific types of use cases and problems.
Deployment
The 9 steps above are only for model building, what about the deployment of the models? Here’s where organizations can make a big stumble. How do you go from your Data Scientists’s model to realizing the model’s worth? This is important because the number of models in production shows where you are in your AI transformation.
Note: Work in Progress (WIP)
Talent
Note: Work in Progress (WIP)
Culture
Note: Work in Progress (WIP)
End Notes
A lot has changed in my world and the general technology space since I first wrote this article. I was working in Engineering and dreaming about working in ‘Data Mining’ back then. As luck would have, I did that. I changed careers at 44 and got into the awesome field of Data Science and Machine Learning. The short it is, I learned a ‘hella lot’ and I hope you do too.
While these 9 steps are a great start, their order no longer makes sense with how things are done in the real world. Remember that when you apply them.