OECD Factbook eXplorer
AI Machine LearningI think I’m going to start a new weekly data visualization feature on Neural Market Trends, starting with the OECD. I love web sites that take complex, and sometimes boring data, and displays them in a visually pleasing way. This week’s data visualization feature is the OECD Factbook eXplorer which is maintained by the Organization for Economic Co-operation and Development.
The OECD is an organization that compiles all kinds of data for many countries and then allows you to display that onto a flash based map. You can easily find data about fertility, employment, and inflation rates for different countries, all with the click of a mouse, and display them on a colorized map. You can zoom in and out, drag the map around, and add more information from pull down menus.
The eXplorer also has a scatter plot, a timeline, a data dashboard, and you have the option to see your data visually and in table form simultaneously. What’s even better is that you can also create data queries and download them into Excel spreadsheets or CSV.
Below are three screenshots of different displayed data visulaizations I created in seconds flat:
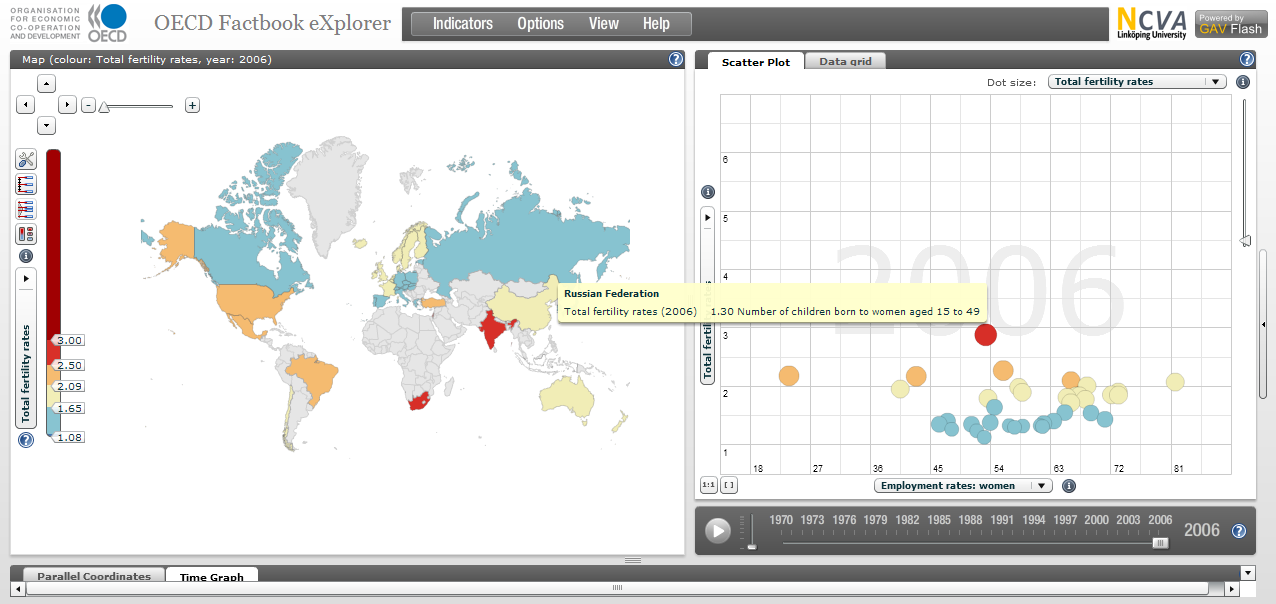
Fertility Rates per Country
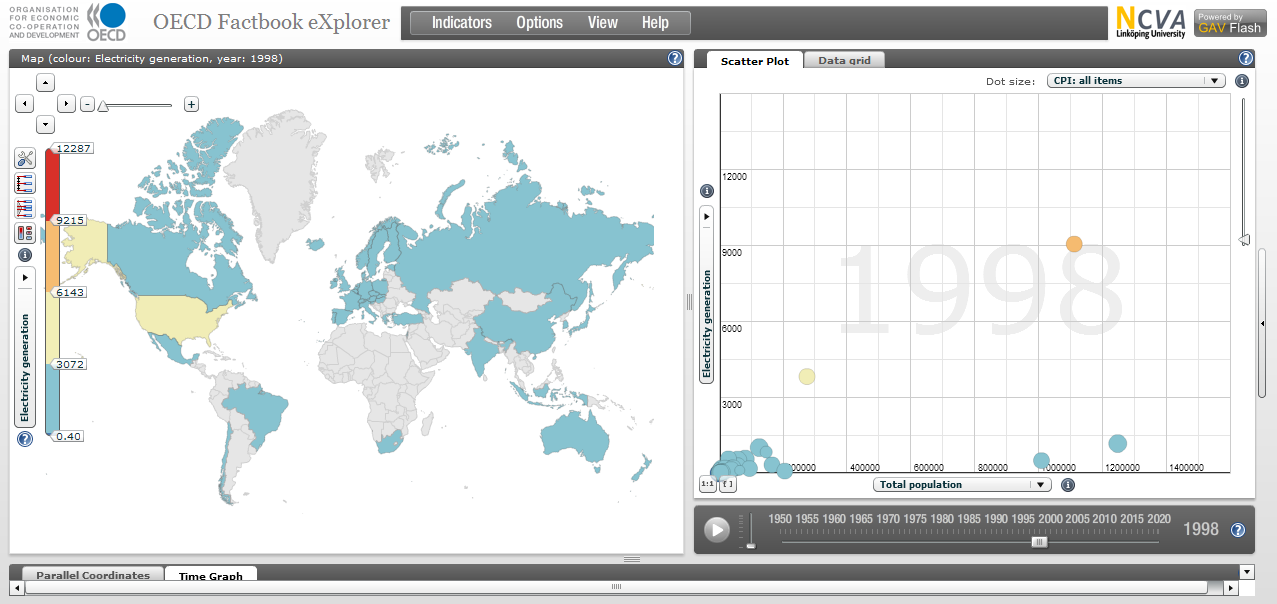
Generation per Country
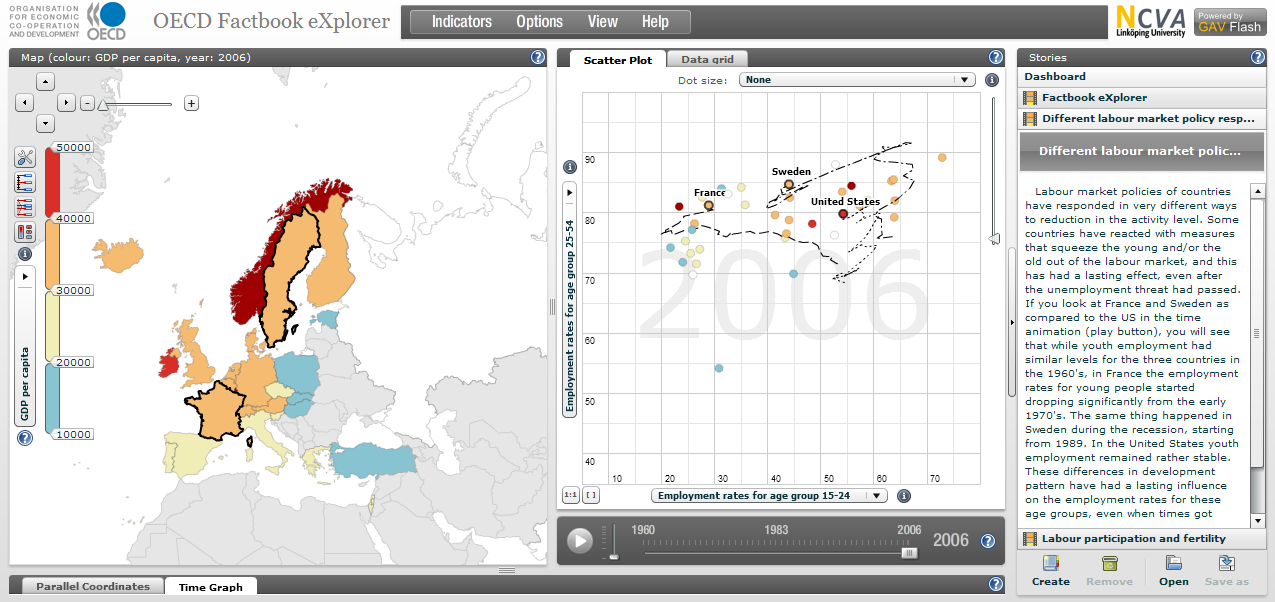
Labour Rates for Europe
As you can see, the OECD website is rich on data visualization and is very useful for researchers, bloggers, and students! Take some time and poke around in there, you’ll be amazed at what you find!